Power BI Documentation
ps4pbi is process.science´s process mining solution embedded in Microsoft Power BI.
Package Content
The package you will receive contains three main components, these and the sub-components are described in the following chapters.
Data Transformers
Regardless the version you purchased (Basic, Advanced, Enterprise) your package contains one version of a data transformer. This data transformer is also called a Event Log Transformer in the Basic and Advanced version and it will be used to prepare your event log data and create the data model needed by the process.science process mining extensions. If your data is stored in a MS SQL Server you will use the SSIS-Packages to transform your data.
Custom Visuals
Currently ps4pbi includes eight custom visuals, they will be used to visualize the process data in your reports. These perfectly matched visuals are optimized to cover all process mining requirements while creating the familiar Power BI experience.
| Extension | Description |
|---|---|
| Process Analyzer | The main visualization, shows your processes in a graph and let´s you filter the data using this graph view. |
| Duration Card | Let´s you display lead times of your cases or between specific activities. |
| Variants / Case Analyzer | Shows each process variant or case in your data and let´s you compare them visually. |
| Events Filter | Let´s you create filters based on the order of activities in your process variants. |
| Lead Time Analyzer | Let´s you analyze lead time between two process steps. |
| Histogram Brush | Let´s you create filters using a slicer within a histogram chart. |
| Multi Field Slicer | Let´s you create filters on multiple columns within the same visual. |
| Root Cause Analyzer | Helps you identify the most likely causes of behaviours, patterns or problems in your process. |
Report Pages
ps4pbi contains pre defined report pages based on commonly asked questions about processes.
| Report Page | Description |
|---|---|
| Summary | Shows an overview of your processes. |
| Details | Shows an overview of your processes including key performance and key process indicators. |
| Rework | Shows an overview over the rework that happens within your processes. |
| Automation | Shows an overview over the current automation status in your processes and helps identifying the potential of automating certain activitites. |
| Benchmark | Helps you compare two process flows based on selected dimensions selected by you. |
| Lead Times | Helps you find out more about your lead times between certain process steps. |
| Variants | Helps you compare multiple process variants based on the ordering of activities in each variant. |
| Conformance | Helps you check wether your defined target processes match your real processes. |
Info
If you purchased the enterprise edition your package will contain an additional documentation explaining the reports of your content package.
Getting Started
Before you can start analyzing your processes you need to prepare your event log and load the data into the (pre-defined) reports. This documentation will provide you with the needed information to create the event log, transform it into our data model, use our extensions and set them up in new report pages.
Event Log
Input for every data load is the event log, it must contain at least 3 main elements:
- The case id identifies the single process instance by connecting events to a uniqe business case.
- A timestamp traces when a given activity took place in this specific instan- ce of process execution.
- An activity name that describes which step was executed.
You can extend this minimal needed event log with additonal case- and event-based information. The data structure is designed to be flexible.
Data Model
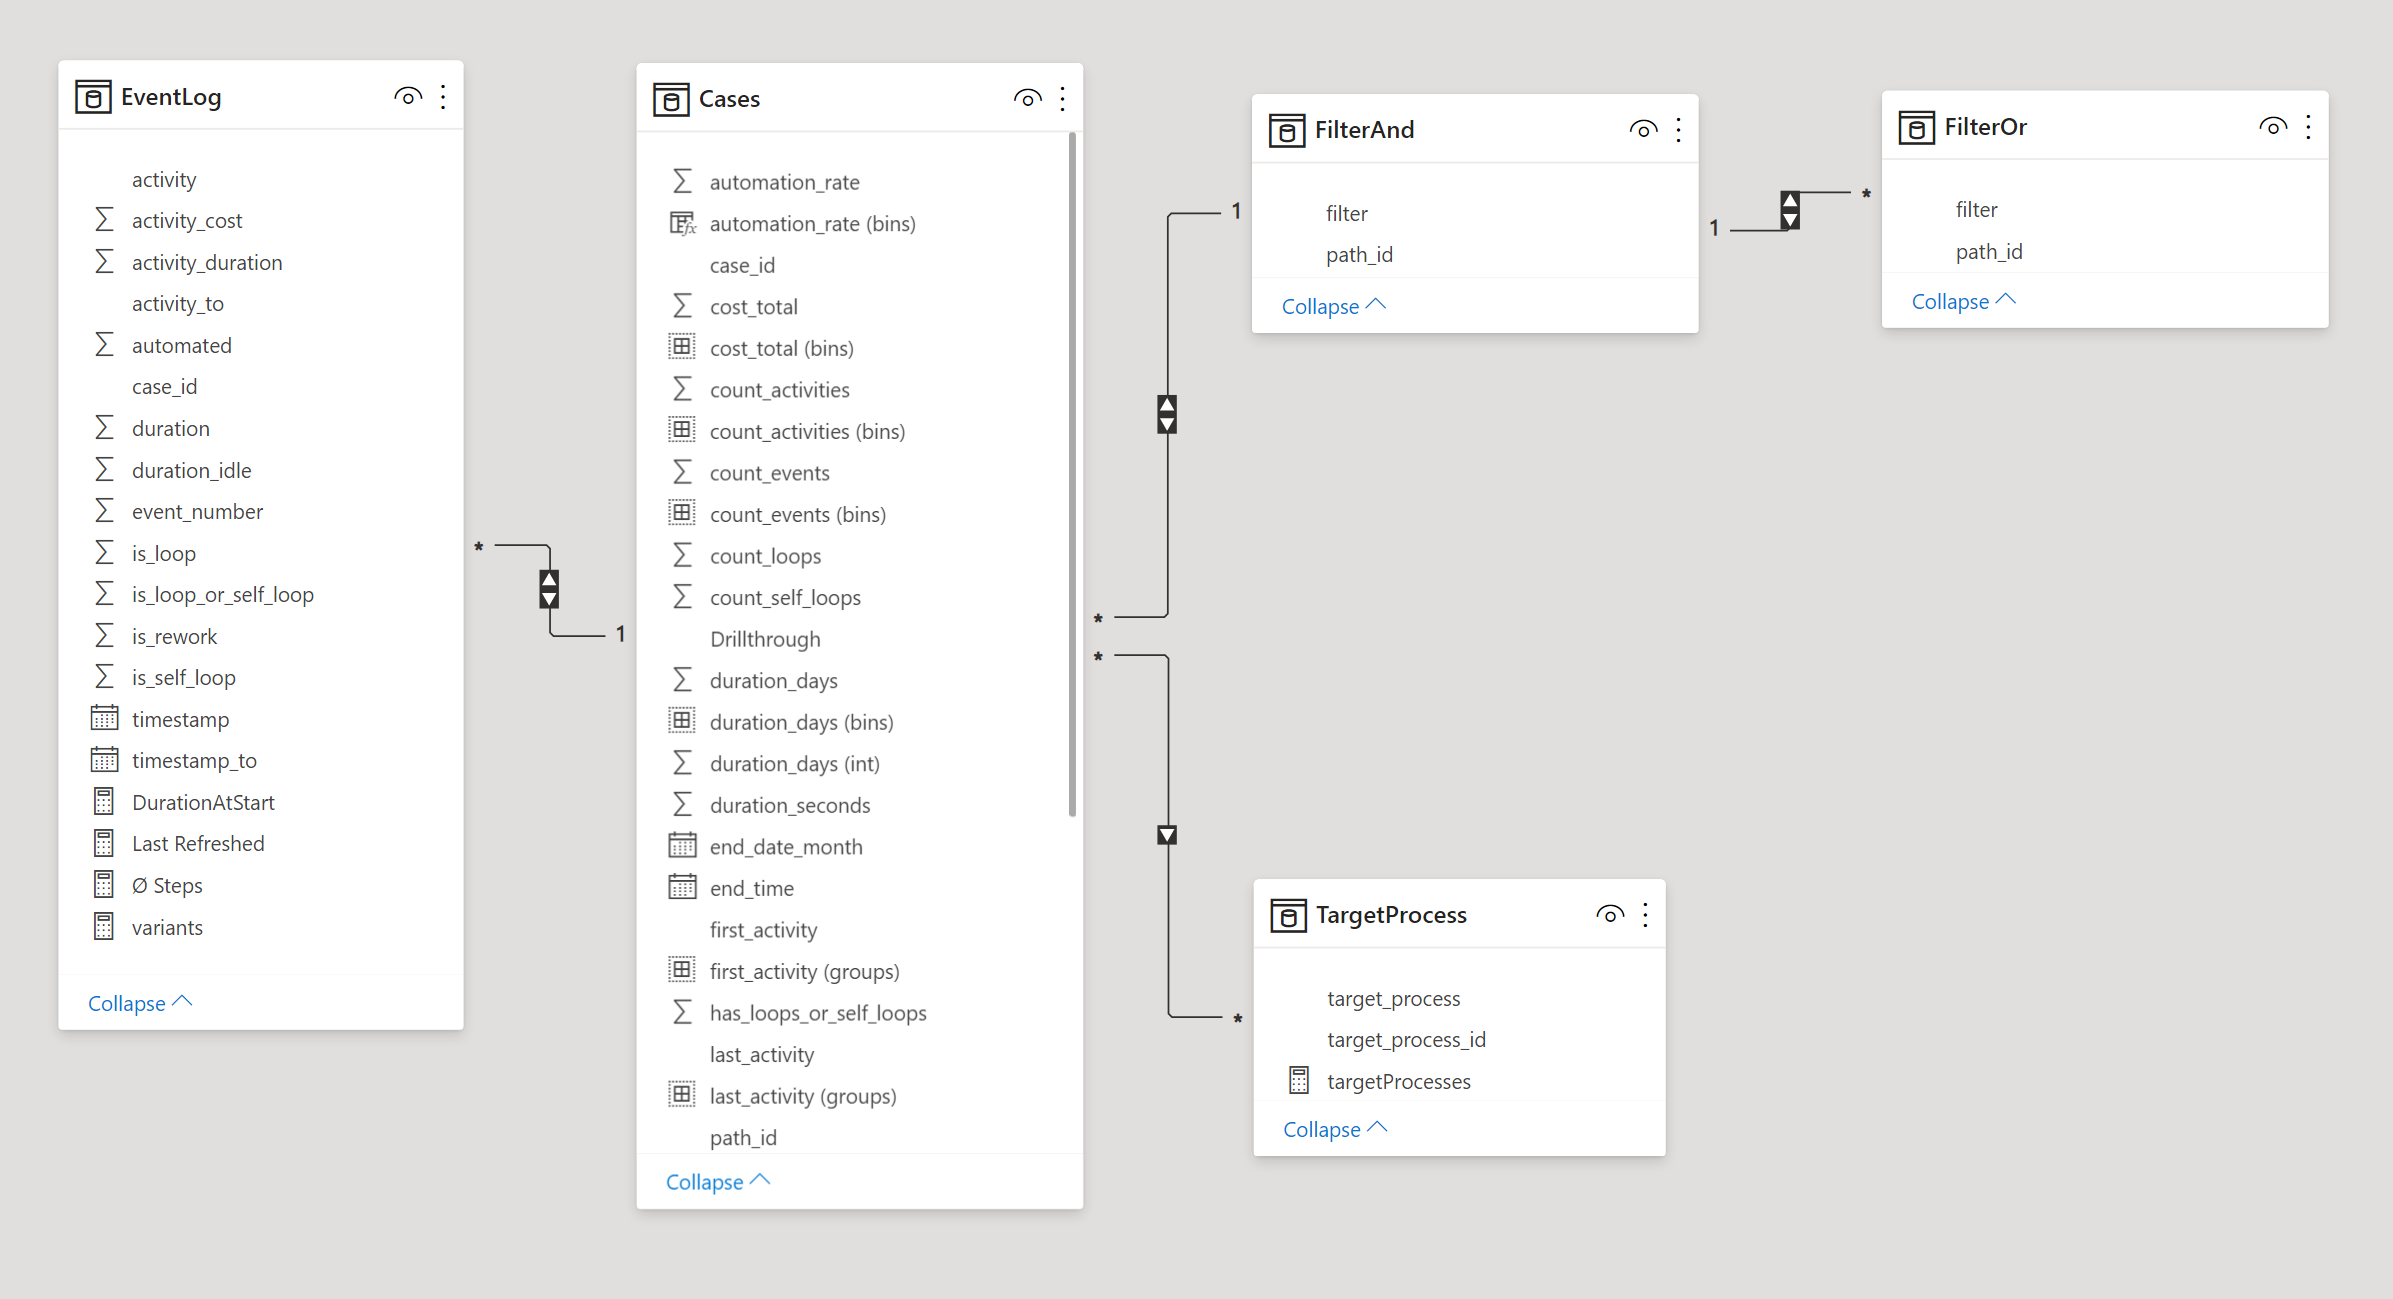
The data model, created by the event log transformer or the ssis-package, consists of the Eventlog including the event based information, the Cases data which includes case-based information, the TargetProcess table defining the refernce models of your processes and the filter tables FilterAnd and FilterOr. A more detailed overview is provided under Data Model.