
Events Filter
Setup
Import the visual via the menu into the existing report, the name of the visual is psEventsFilter.pbiviz.
Working with the template files
Within the process.science template files all visuals have no license key. Before you can start working with the template files you need to add the provided license key as explained in the chapter Loading the license key into the report.
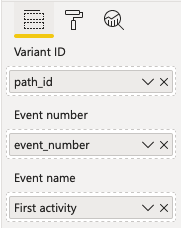
Afterwards you have to add the dimensions path_id from the Cases table and event_number & activity from the Eventlog table to the visual. For the activity, you must set that the first data record is taken. After you have done this, the possible events are displayed.
Important
To be able to work in edit mode, you must drag the measure UserName from the table Cases into the field User Name of the visual.
The visual has the following icon in the menu:

Functionalities
The Events Filter by process.science offers the possibility to detect deviations or conformity problems in your process. You can analyse the sequence of process steps in your process flow and draw conclusions about compliance with predefined rules. These are described in the following chapters.
Activity list
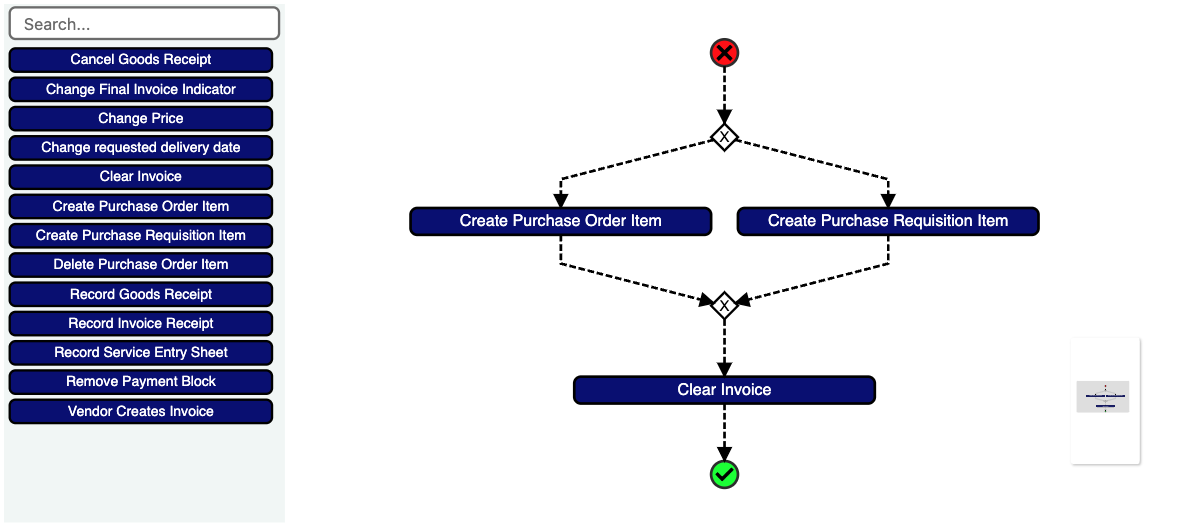
From this list, you can drag the activities with which you want to create process flows into the diagram and drop them at the desired locations. You can drag and drop as many activities as you like. The activities can also be used several times and you can quickly find the desired activity using the search in the activity list.
Build process flow
To build a process flow, drag the desired activities from the activity list into the diagram and drop them in the desired places. You can also use the activities more than once. If you want to remove an activity from the diagram, click on the X in the upper right corner of the activity. You can drag activities from the process flow to other positions in order to change the flow.
Sequence
To build a linear sequence, place the activity between two existing activities. The activity is then inserted between the two activities.
Branching
To build a branch, place the activity on top of an existing activity. The activity is then inserted next to the already existing activity and a branch is built. If you have selected “Always choose” as the default branch type, you must then select the type for this branch by clicking on the corresponding diamond shape. Drop an activity on a branch symbol (the diamond with x or +) to add another branch to this branch. By clicking on the branch symbol, the type of branch can be changed. There are the following branches:
| Branch | Illustration | Description |
|---|---|---|
Parallel | 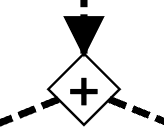 | All activities from all branches must have been executed before the following activities are executed. The order of the branches is irrelevant. |
Alternative | 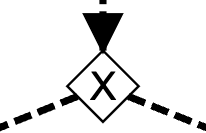 | The activities from one of the branches must have been executed out before the subsequent activities are executed. The order of the branches does not matter. |
Preview
If you drag an activity over the process flow, a preview is shown of what the process flow will look like when you drop the activity at this point. Everything that belongs to the preview is displayed in the preview color.
Set activity connections
An activity can be directly followed, eventually followed, not directly followed or not eventually followed by the following activity in the sequence. Please refer to the table for the exact description (incl. illustration):
| Connection | Illustration | Description |
|---|---|---|
directly followed | 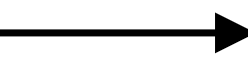 | The activity must follow directly after the previous activity. |
eventually followed | 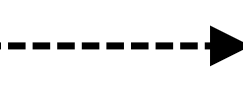 | The activity must follow sometime after the previous activity. |
not directly followed |  | The activity must not follow directly after the previous activity. |
not eventually followed |  | The activity must not follow at some point after the previous activity. |
How to set the relationships between the activities
The paths between the activities determine whether the activities are followed directly or indirectly. A left click on the arrow changes from direct to indirect and vice versa.
The activities determine whether they are included or excluded. Right-click on the activity to switch between included and excluded.
Several paths/activities can also be selected at the same time. Clicking on a gateway changes all subsequent paths/activities.
Filter
Whenever a new path is built, it is checked whether there are possible variants for this path. If there are variants, the filter icon  is active and variants can be selected by clicking the icon. If the icon is inactive
  , there are no variants and it is not possible to filter. The current graph can be reset via the icon
  at the top of the graph. This button does not delete the filter in Power BI.
If an existing filter is active, a filter icon  is displayed in the upper left area. This icon can be used to reset the filter. This button does not delete the graph in the visual.
Settings
The following chapters explain the possible settings.
Graph layout
The alignment and node spacing of the graph can be set here.
| Setting | Description |
|---|---|
Graph Alignment | The alignment of the graph. |
Node Spacing | The spacing between nodes in the graph. |
rank spacing | The distance between the ranks in the graph. |
Edge Distance | The distance between the graph and the edge of the visual. |
Graph settings
The settings for the graph can be made here.
| Setting | Description |
|---|---|
Node color | The color of the nodes in the graph. |
Text Color | The text color for the nodes in the graph. |
Including Activity Color | The color for the including activities in the graph. |
Excluding Activity Color | The color for the excluding activities in the graph. |
Preview Color | The color for the preview in the graph. |
Default branch type | The default type of new branches. |
Font Size | The font size for the nodes in the graph. |
Line Break | The number of words after which a line break should occur. |
Menu Settings
The settings for the menu can be made here.
| Setting | Description |
|---|---|
Menu Position | The position of the menu. |
Filter Icon Color | The color of the Filter icon. |
Reset icon color | The color of the Reset icon. |
Warning icon color | The color of the Warning icon. |
Show Background | When this option is enabled, the background of the menu is displayed. |
Background Color | The background color of the menu. |
Menu Size Mode | The mode for the size of the menu (automatic, pixel, percent). |
Menu Size | The size of the menu. |
Filter settings
The settings for the filter.
| Setting | Description |
|---|---|
Reset graph when filter is reset | If this option is activated, the graph is reset when the filter is reset. |
Reset filter when graph is reset | If this option is enabled, the filter is reset when the graph is reset. |