
Root Cause Analyzer
Setup
Import the visual via the menu into the existing report, the name of the visual is psRootCauseAnalyzer.pbiviz.
Working with the template files
Within the process.science template files all visuals have no license key. Before you can start working with the template files you need to add the provided license key as explained in the chapter Loading the license key into the report.
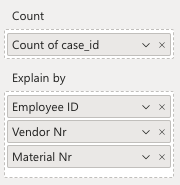
Count: The field corresponding to the required level of granularity (Case, Event, Edge Levels) should be dragged into the Count bucket and set to Count in the drop down menu (e.g. case_id from the Cases table to explain case attributes, or case_id from the Event Log table to explain event attributes).
Explain By: Relevant attributes that the Root Cause Analyzer should consider when analysing root causes. Ideally, you should include attributes that are categorical in nature, such as User, Start Activity, Material No., Vendor, etc., but avoid those that are continuous, such as Duration, Cost, Quantity, etc.
Important
To be able to work in edit mode, you must drag the measure UserName from the table Cases into the field User Name of the visual.
The visual has the following icon in the menu:

Important
The Root Cause Analyzer works like a selection visual (not like a slicer visual). This means that you have to pay attention to your visual settings. The interaction settings of the selection visualisation must be set to Highlight, otherwise the Root Cause Analyzer will not work properly.
Functionalities
The Root Cause Analyzer by process.science helps you identify the most likely causes of behaviours, patterns or problems in your process. With the Root Cause Analyser you can investigate the drivers of positive process behaviour or find the causes of problems and bottlenecks in your process. With these analysis results, informed business decisions can be better made.
Interpretation
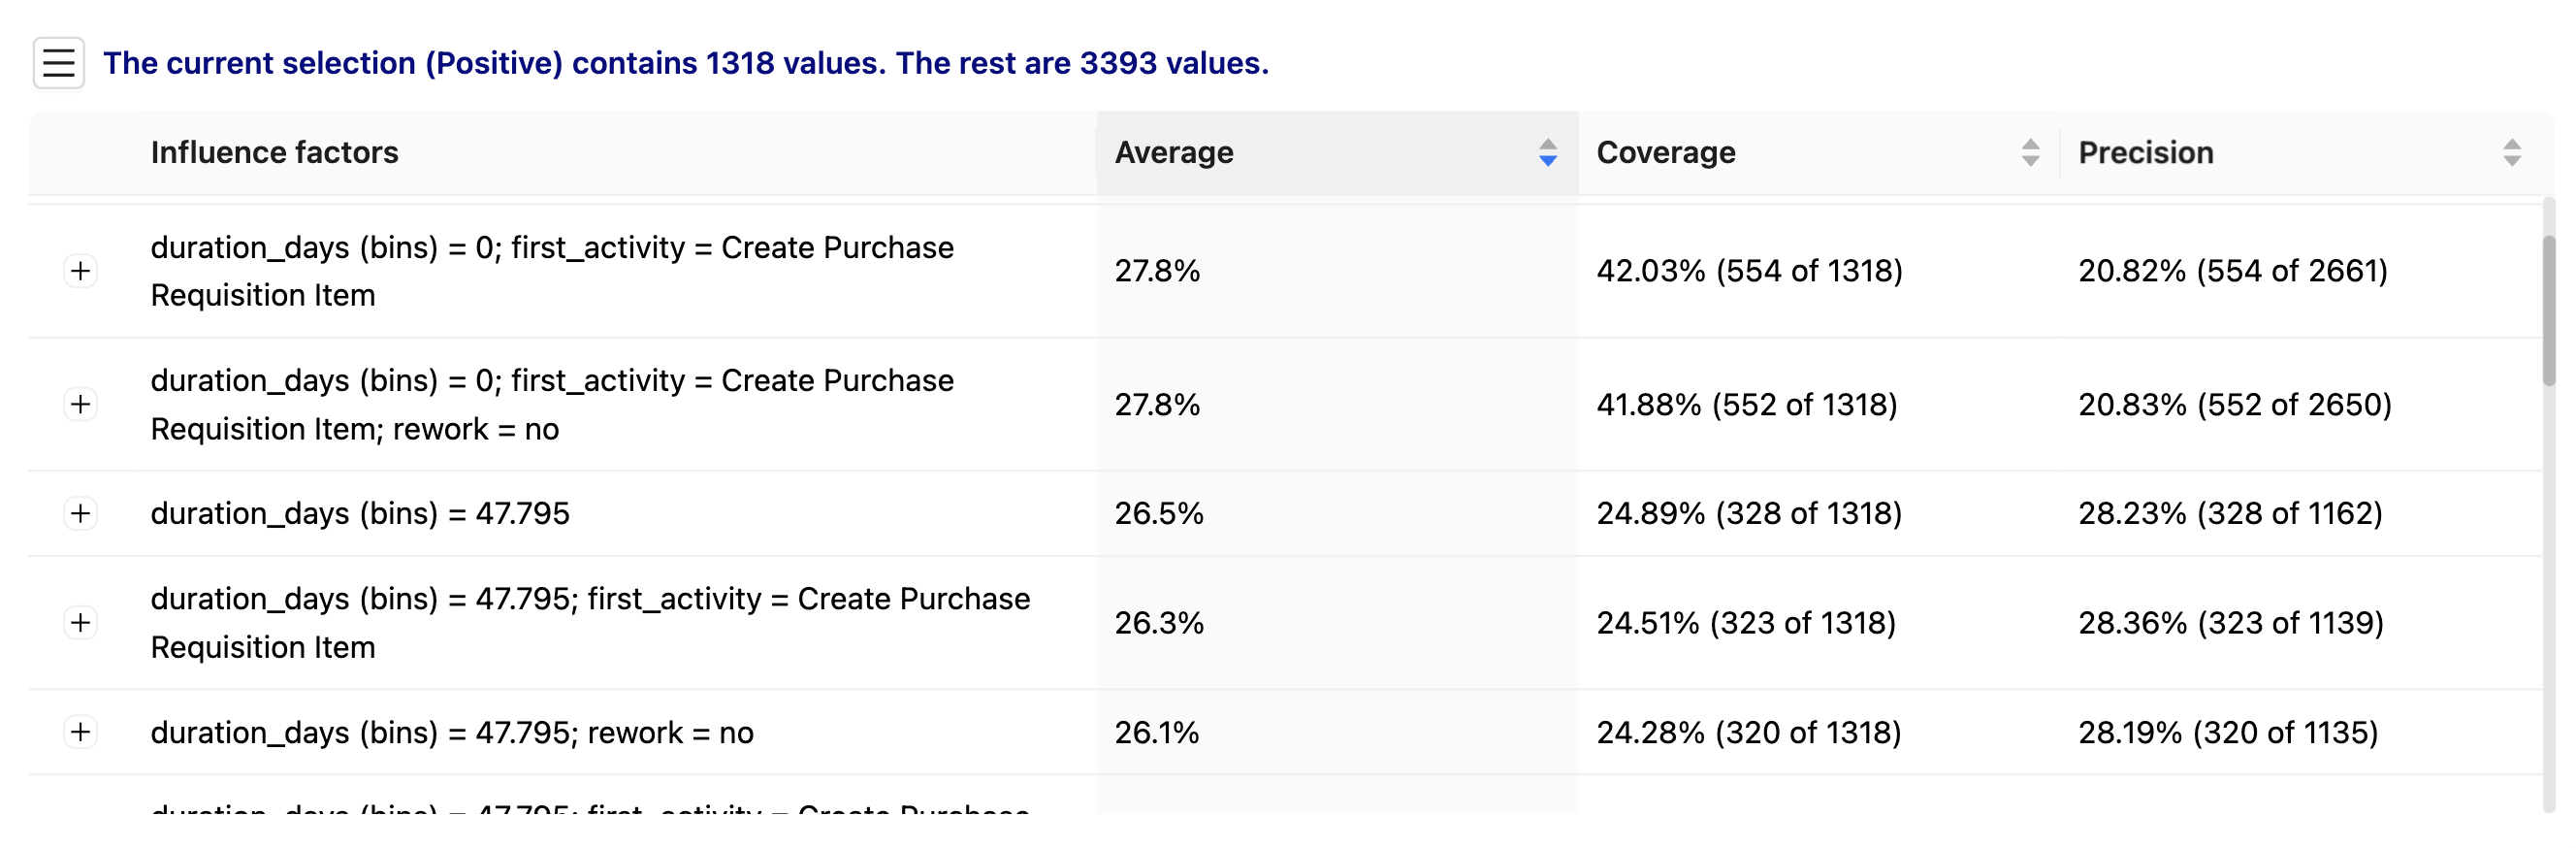
The Root Cause Analyzer calculates an average value based on coverage and precision. The higher both values are close to 100, the higher the influence of the current combination on the analysis, e.g. the occurrence of a certain activity.
By default, the values with the highest average value are displayed at the top, but the sorting can be changed by clicking on the header cells.
By changing the threshold values, certain combinations can be hidden whose influence is too low or too high, i.e. which do not have a direct meaningful influence.
Example
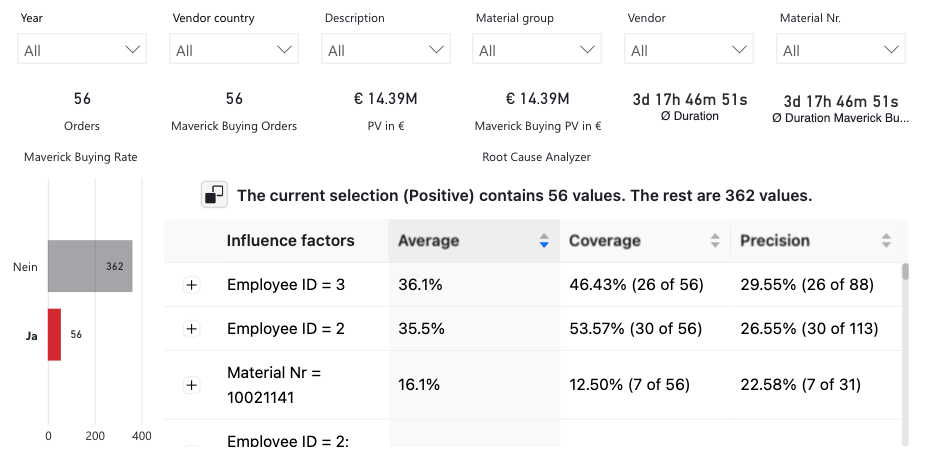
In this example, the factors influencing the occurrence of maverick buying in this process are sought. The table shows that the average value for employees 3 and 2 is very high, i.e. many cases of maverick buying occur.
Selection
By clicking on a line with the Shift key held down, it can be selected and the rest of the report filtered to that find. This allows further information on these influencing factors to be analysed afterwards.
Details
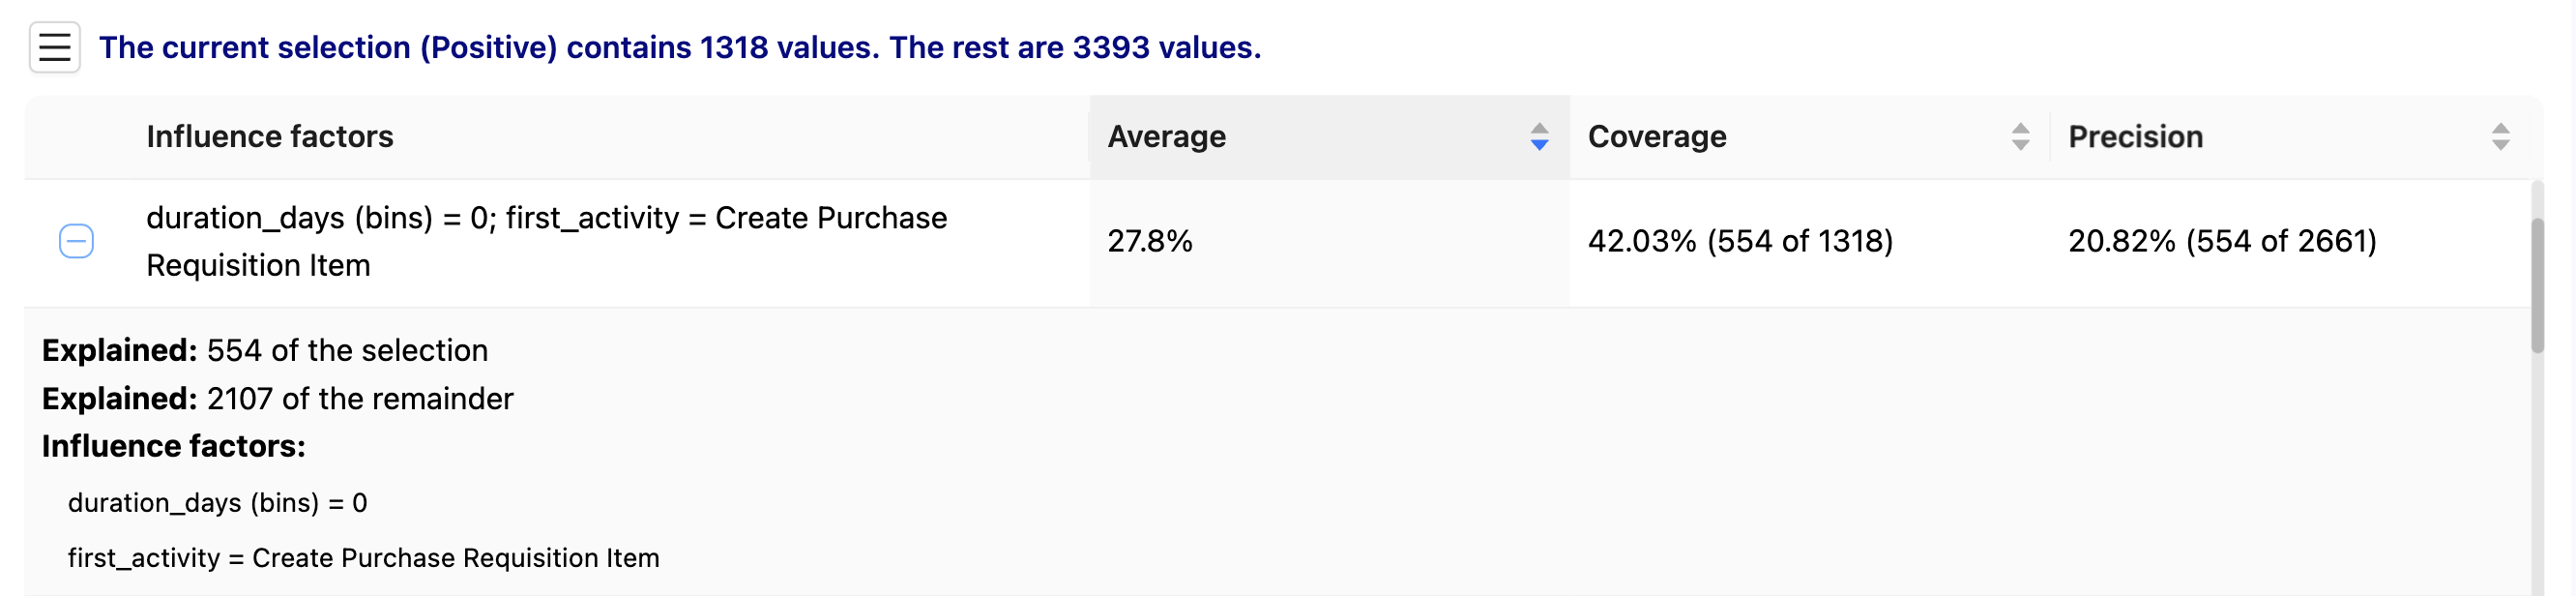
When clicking the small +-icon on the beginning of each row you will see all the details of the result set.
| Detail | Description |
|---|---|
Influence factors | The list of influencing factors with their respective values for the current combination. |
Average | The combined average value from coverage and precision. |
Coverage | Coverage is the percentage of relevant instances that were retrieved, also known as recall. The following question is to be answered: What proportion of true positives were correctly identified? |
Precision | Precision is the proportion of relevant values among the values found. The following question is to be answered: What proportion of the positive identifications was actually correct? |
Explained selection | The values of the current selection, which are selected by a data point in another visual. |
Explained remainder | The remaining values of the current selection that were not selected by the currently selected data point of another visual. |
Invert Selection
By clicking on the invert buttom in the left-hand corner of the table, you can change to the negative swalll. Now all values are displayed that have a negative effect on the current analysis. In relation to the maverick buying example from above, the factors are now displayed for which hardly any maverick buying occurs.
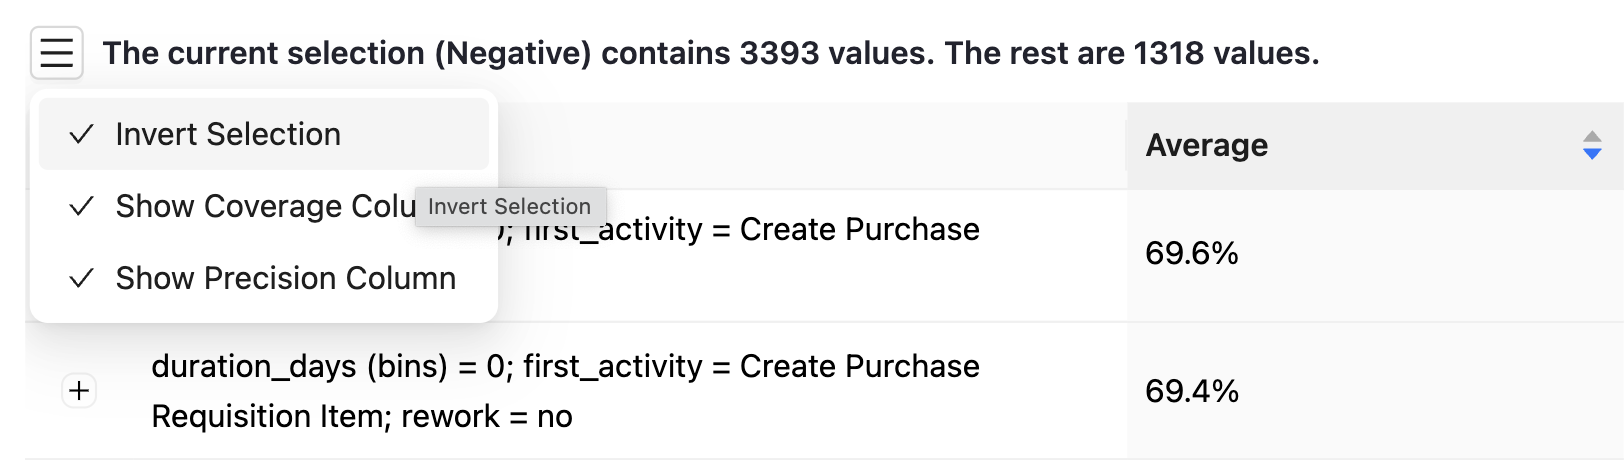
Settings
In the following chapters the possible settings are explained.
Root Cause Analyzer settings
You can adjust the general behavior in the Root Cause Analyzer settings submenu.
| Setting | Description |
|---|---|
Pause Analysis | Specifies whether the Root Cause Analyzer should be active or paused by default. |
Multivariate Analysis | Specifies whether the Root Cause Analyser should work in multivariate (combine values) or binary (do not combine values) mode. |
Selection Mode | Specifies whether the Root Cause Analyser should look at positive or negative influence factors by default. |
Lower treshold | Specifies the lower threshold value for influencing factors above which they are displayed. are displayed. |
Upper treshold | Indicates the upper threshold value for influencing factors up to which they are still displayed. |
Color settings
You can adjust the colors of the visual in the Color settings submenu.
| Setting | Description |
|---|---|
Text color | The text color of the Root Cause Analyzer. |
Positive Color | The color when the positive mode is active. The first color of your color scheme will be used as default. |
Negative color | The color when the negative mode is active. The second color of your color scheme will be used as default. |
Table settings
You can adjust the table UI in the Table settings submenu.
| Setting | Description |
|---|---|
Size | The size of the elements and rows in the table, either small or normal. |
Truncate Influence Factor Column | Specifies whether the text in the "Influencing factors" column is to be truncated. |
Display Precision Column | Indicates whether to display the Precision column. |
Display Coverage Column | Indicates whether to display the Coverage column. |