
ps4PBI Data Model
The data model, created by the event log transformer or the ssis-package, consists of the EventLog including the event based information, the Cases data which includes case-based information, the TargetProcess table defining the refernce models of your processes and the filter tables FilterAnd and FilterOr.
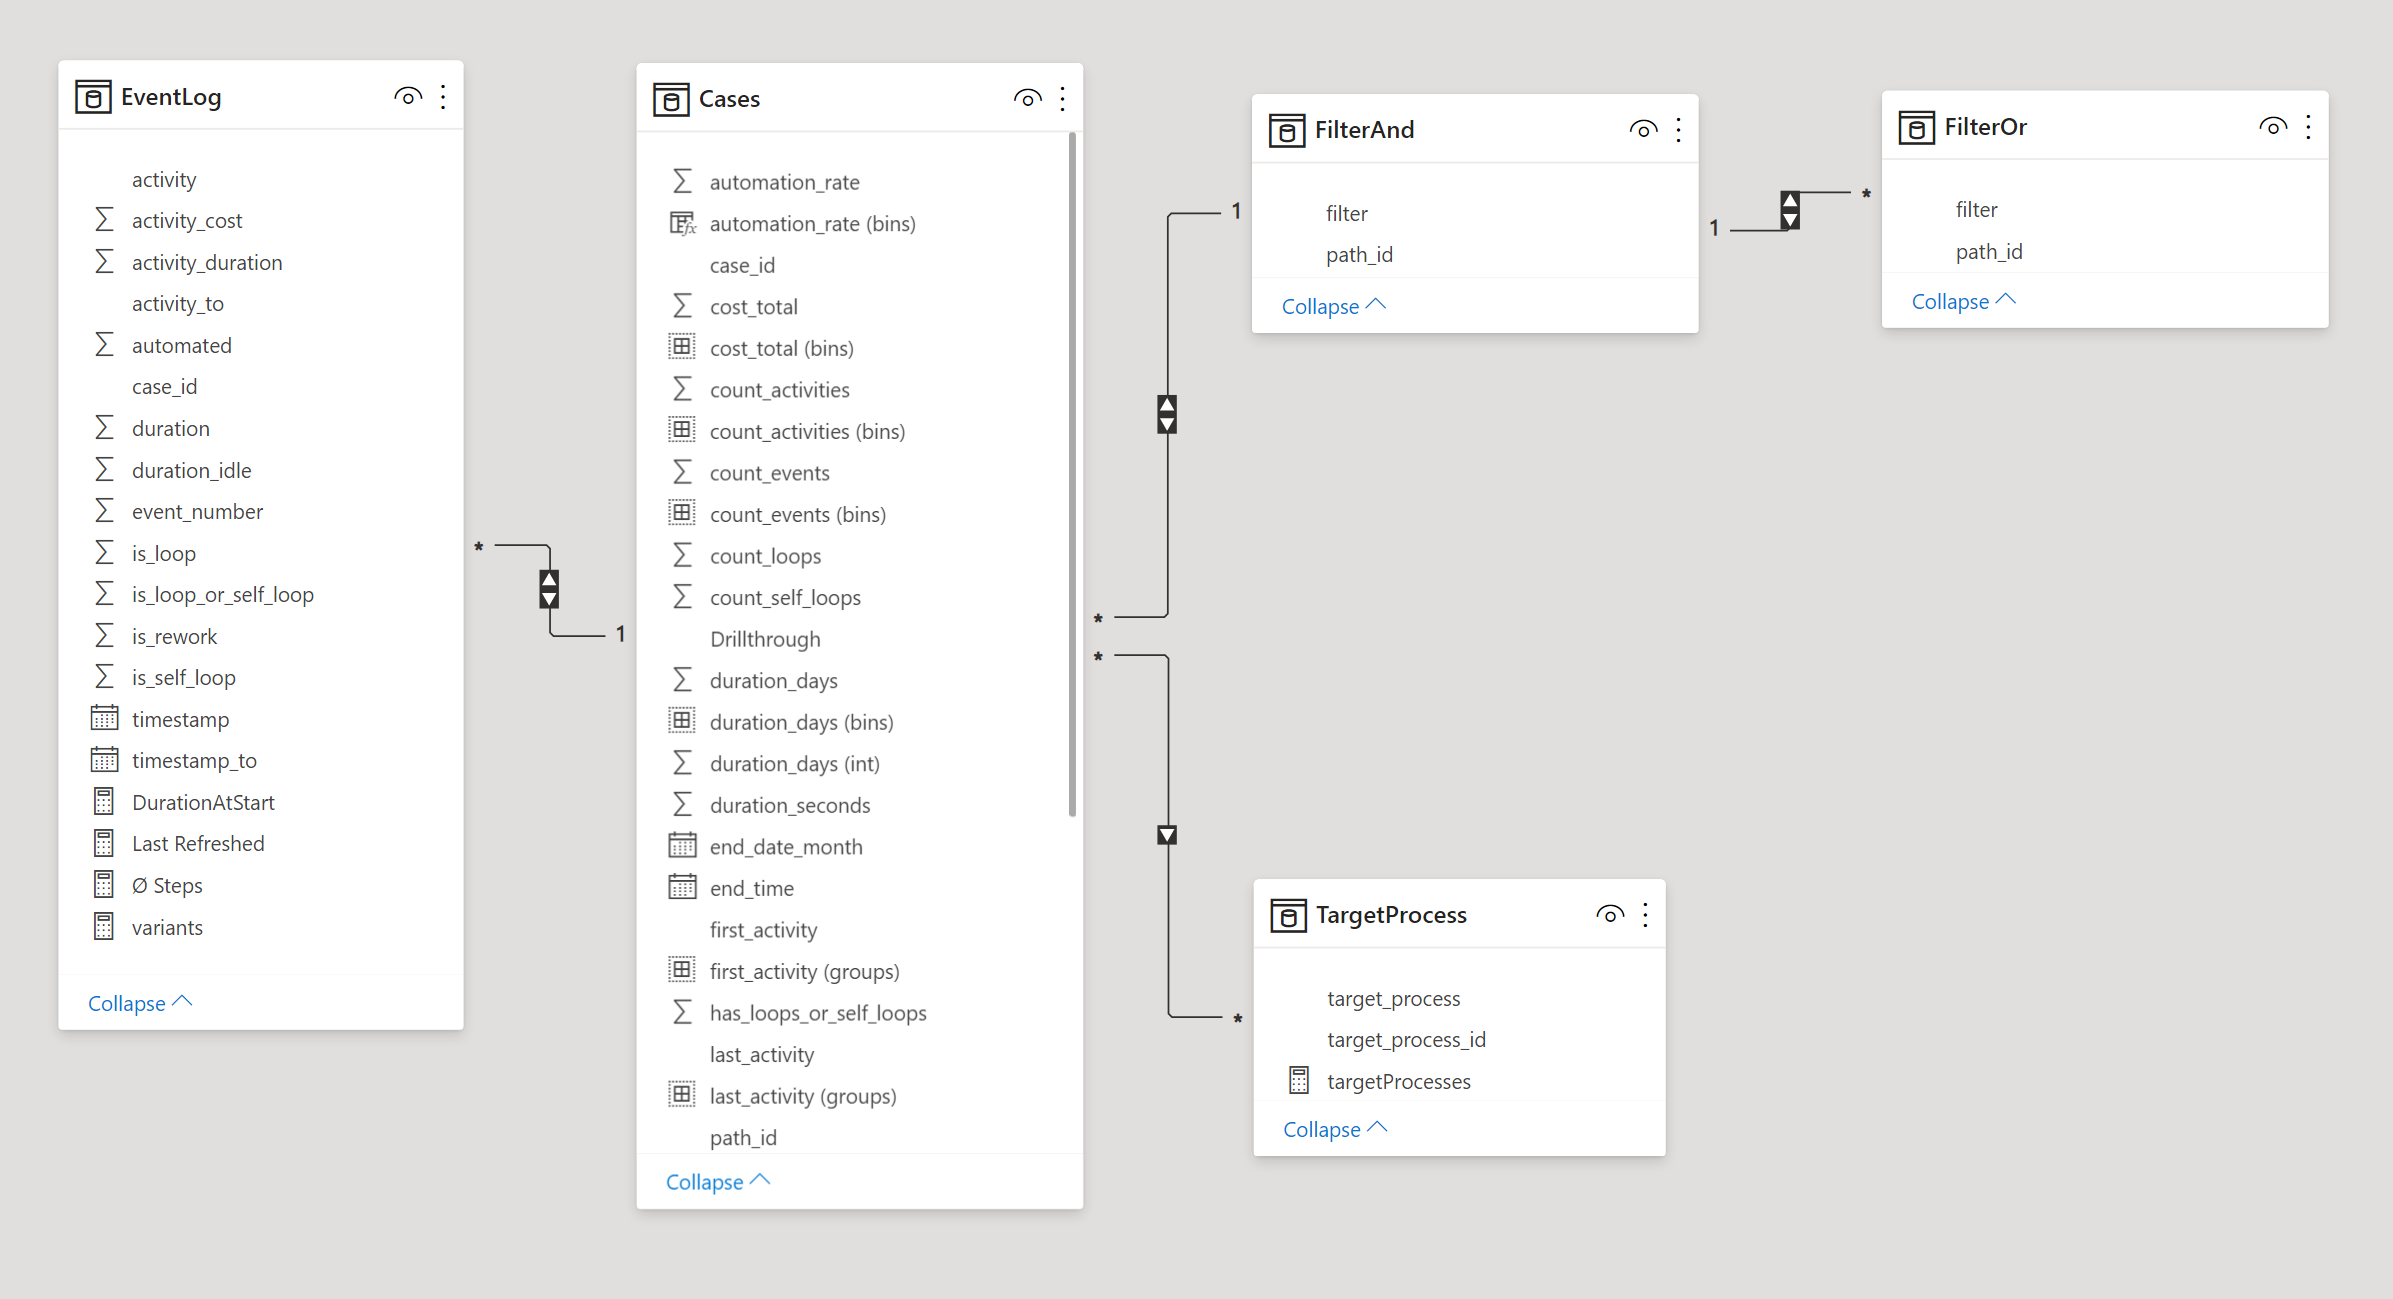
Event Log
The EventLog contains the event based information for each process step and the pre calculated process transitions.
| Folder Name | Field Name | Data Type | Description |
|---|---|---|---|
General Columns | case_id | Text | The case id. Can be used to show frequencies on activities and edges within the Process Analyzer. |
General Columns | activity | Text | The activity name for the event. To start analyzing your processes you need to drag this field in the 'Event (From)' bucket of the Process Analyzer. |
General Columns | activity_to | Text | The activity name for the following event. To start analyzing your processes you need to drag this field in the 'Event (To)' bucket of the Process Analyzer. |
General Columns | variants | Measure | To start analyzing your processes you need to drag this field in the 'Variants' bucket of the Process Analyzer. |
Event Values | activity_cost | Fixed decimal number | The cost of an activity, can be used in the activity fields of the Process Analyzer. |
Event Values | activity_duration | Decimal number | The duration of an activity, can be used in the activity fields of the Process Analyzer. |
Event Values | automated | Decimal number | Flag if the activity was automated or not. |
Event Values | duration_at_start | Decimal number | The duration at the start of this event from the beginning of this case. |
Event Values | event_number | Whole number | The position the event occurs in the variant. Is used in the Events Filter and the Variants / Case Analyzer. |
Event Values | is_rework | Decimal number | Flag if this activity occurs at least a second time (=1) and is a rework or not (=0). |
Edge Values | duration | Decimal number | The duration between two activities, can be used as an edge value in the Process Analyzer. |
Edge Values | duration_idle | Decimal number | The duration between two activities, excluding the activity duration. Can be used as a edge value in the Process Analyzer. |
Edge Values | is_loop | Decimal number | Indicates if the following activity occurs at least a second time and this transitions completes the loop (=1) or not (=0). |
Edge Values | is_loop_or_self_loop | Decimal number | Flag if this is a loop/selfloop (=1) or not (=0). |
Edge Values | is_self_loop | Decimal number | Flag if this is a selfloop (=1) or not (=0), meaning activity from equals the activity to. |
Additional Values | timestamp | Date/Time | The start timestamp of the current activity. |
Additional Values | timestamp_to | Date/Time | The end timestamp of the current activity. |
Additional Measures | Ø Steps | Measure | The average step count per case id. |
Additional Measures | Last Refreshed | Measure | The timestamp of the last data refresh. |
Cases Data
The Cases contains the cases based information for each process instance.
| Folder Name | Field Name | Data Type | Description |
|---|---|---|---|
Case Dimensions | automation_rate | Decimal number | The total automation rate of this case, is calculated using the automation field you provided for each activity while transforming the data. |
Case Dimensions | case_id | Text | The case id. |
Case Dimensions | cost_total | Text | The total cost of this case, is calculated as the sum of cost field you provided for each activity while transforming the data. |
Case Dimensions | count_activities | Whole number | The count of (distinct) activities per case, this may be lower than the count of events. |
Case Dimensions | count_events | Whole number | The count of events per case, same activities will be counted more than once. |
Case Dimensions | count_loops | Whole number | The count of process loops per case, this does not includes the self loops. |
Case Dimensions | count_self_loops | Whole number | The count of the self loops per case. |
Case Dimensions | has_loops_or_self_loops | Whole number | Flag if the case has loops (=1) or does not has loops (=0). |
Case Dimensions | duration_days | Decimal number | The total duration of this case calculated in days. |
Case Dimensions | duration_seconds | Whole number | The total duration of this case calculated in seconds. |
Case Dimensions | start_time | Date/Time | The timestamp of this case at the beginning of the execution. |
Case Dimensions | end_time | Date/Time | The timestamp of this case at the end of the execution. |
Case Dimensions | start_date_month | Date | The month and year part of the start timestamp of this case. |
Case Dimensions | end_date_month | Date | The month and year part of the end timestamp of this case. |
Case Dimensions | first_activity | Text | The name of the first activity of this process instance. |
Case Dimensions | last_activity | Text | The name of the last activity of this process instance. |
Case Dimensions | path_id | Whole number | The variant/path id of this case. |
Case Dimensions | rework | Text | Transformed flag of the has_loops_or_self_loops field if this process instance has reworks (yes/no). |
Case Dimensions | target_process_id | Whole Number | The target process id. Provide different target process ids if you want to create different target processes for different departments. |
Case Dimensions | unique_variant | Whole Number | Flag if this case has a unique variant (=1) or or not (=0). |
Case Dimensions | unique_variant_text | Text | Flag in text form if this case has a unique variant (=yes) or or not (=no). |
Case Groups & Bins | automation_rate (bins) | Text | The bins created for the total automation rate of each process instance. There will always be ten groups with ten percentage steps. Use this to create easier to read charts with grouped automation rates. |
Case Groups & Bins | cost_total (bins) | Fixed decimal number | The bins created for the total cost of each process instance. Use this to create easier to read charts with grouped cost values. |
Case Groups & Bins | count_activities (bins) | Decimal number | The bins created for the count of activities of each process instance. Use this to create easier to read charts with grouped count of activities values. |
Case Groups & Bins | count_events (bins) | Whole number | The bins created for the count of events of each process instance. Use this to create easier to read charts with grouped count of events values. |
Case Groups & Bins | duration_days (bins) | Decimal number | The bins created for the duration in days of each process instance. Use this to create easier to read charts with grouped duration in days. |
Case Groups & Bins | first_activity (groups) | Text | The groups created for the first activity of each process instance. Use this to create easier to read charts with grouped first activities. |
Case Groups & Bins | last_activity (groups) | Text | The groups created for the last activity of each process instance. Use this to create easier to read charts with grouped last activities. |
Case Measures | # Total Cases | Measure | The total cases, filters are ignored. Can be used in gauge diagrams to show the maximum value. |
Case Measures | # Total Events | Measure | The total event count, filters are ignored. Can be used in gauge diagrams to show the maximum value. |
Case Measures | # Total Variants | Measure | The total process variants count, filters are ignored. Can be used in gauge diagrams to show the maximum value. |
Case Measures | Average Automation Rate | Measure | The average automation rate calculated over all cases. |
Case Measures | Percentage Has Loops or Self Loop | Measure | Percentage of cases with loops or selfloops. |
Drillthrough | Drillthrough | Text | Use this field to create drillthrough filters. |
Target Process
The TargetProcess contains the target process you provided to validate your target process with the actuall process. If you do not provide a target process the top process variants will be automatically used as the target processes.
| Field Name | Data Type | Description |
|---|---|---|
| target_process | Text | The process path defined as one target process. You can combine multiple process paths for one process id if you add '&&' between the paths. |
| target_process_id | Whole number | The target process id. Provide different target process ids if you want to create different target processes for different departments. |
| targetProcesses | Measure | The measure to combine all target processes currently selected. Is used in the Process Analyzer. |
Filter Tables
In addition to the tables mentioned above two filter tables FilterAnd and FilterOr are part of the data model. These tables are mandatory for the use of the ps4PBI visuals and are not to be removed.
ps4PBI Data Model (Grouped)
If you are working with grouped activities your data model will also have the following additional tables and columns. The data model, created by the event log transformer or the ssis-package, consists of the EventLogGrouped including the event based information, the ActivityGroupMap table defining the mapping from detailed activities to grouped activities and the filter tables FilterAndGrouped and FilterOrGrouped.
We are providing an additional report if you want to work with activity groups. Both for the Event Log Transformer and the SSIS package.
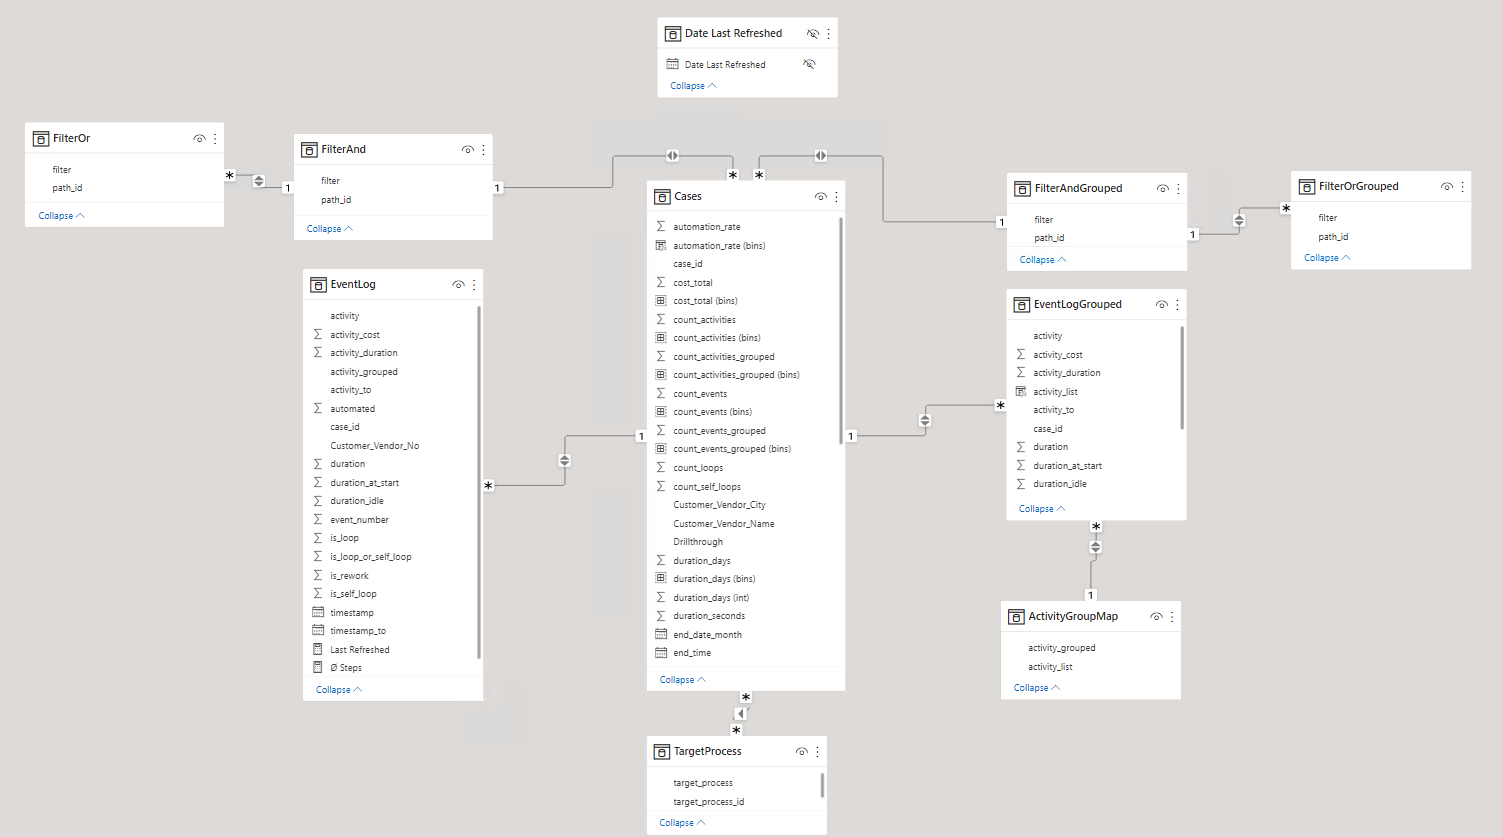
Event Log
The EventLog contains the event based information for each process step and the pre calculated process transitions.
| Folder Name | Field Name | Data Type | Description |
|---|---|---|---|
General Columns | activity_grouped | Text | The activity name of the group for the event. |
Event Log Grouped
The EventLogGrouped contains the event based information for each process step and the pre calculated process transitions.
| Folder Name | Field Name | Data Type | Description |
|---|---|---|---|
General Columns | case_id | Text | The case id. Can be used to show frequencies on activities and edges within the Process Analyzer. |
General Columns | activity | Text | The activity name for the event. To start analyzing your processes you need to drag this field in the 'Event (From)' bucket of the Process Analyzer. |
General Columns | activity_to | Text | The activity name for the following event. To start analyzing your processes you need to drag this field in the 'Event (To)' bucket of the Process Analyzer. |
General Columns | variantsGrouped | Measure | To start analyzing your processes you need to drag this field in the 'Variants' bucket of the Process Analyzer. |
Event Values | activity_cost | Fixed decimal number | The cost of an activity, can be used in the activity fields of the Process Analyzer. |
Event Values | activity_duration | Decimal number | The duration from start of the first detailed activity to the end timestamp of the last detailed activity of this group. Can be used in the activity fields of the Process Analyzer. |
Event Values | working_duration | Decimal number | The sum of the activity duration of all activities of this group. Times between detailed activities will be left out. Can be used in the activity fields of the Process Analyzer. |
Event Values | duration_at_start | Decimal number | The duration at the start of this event from the beginning of this case. |
Event Values | event_number | Whole number | The position the event occurs in the variant. Is used in the Events Filter and the Variants / Case Analyzer. |
Event Values | activity_list | Text | The list of all activities the grouped activity consists of. |
Edge Values | duration | Decimal number | The duration between two activities, can be used as an edge value in the Process Analyzer. |
Edge Values | duration_idle | Decimal number | The duration between two activities, excluding the activity duration. Can be used as a edge value in the Process Analyzer. |
Additional Values | timestamp | Date/Time | The start timestamp of the current activity. |
Additional Values | timestamp_to | Date/Time | The end timestamp of the current activity. |
Cases Data
The Cases contains the cases based information for each process instance.
| Folder Name | Field Name | Data Type | Description |
|---|---|---|---|
Case Dimensions Grouped | count_activities_grouped | Whole number | The count of (distinct) grouped activities per case, this may be lower than the count of events. |
Case Dimensions Grouped | count_events_grouped | Whole number | The count of grouped events per case, same activities will be counted more than once. |
Case Dimensions Grouped | first_activity_grouped | Text | The name of the first activity grouped of this process instance. |
Case Dimensions Grouped | last_activity_grouped | Text | The name of the last activity grouped of this process instance. |
Case Dimensions Grouped | path_id_grouped | Whole number | The grouped variant/path id of this case. |
Case Dimensions Grouped | unique_variant_grouped | Whole Number | Flag if this case has a unique grouped variant (=1) or or not (=0). |
Case Dimensions Grouped | unique_variant_text_grouped | Text | Flag in text form if this case has a unique grouped variant (=yes) or or not (=no). |
Case Groups & Bins | count_activities_grouped (bins) | Decimal number | The bins created for the count of grouped activities of each process instance. Use this to create easier to read charts with grouped count of activities values. |
Case Groups & Bins | count_events_grouped (bins) | Whole number | The bins created for the count of grouped events of each process instance. Use this to create easier to read charts with grouped count of events values. |
Case Measures | # Total Cases | Measure | The total cases, filters are ignored. Can be used in gauge diagrams to show the maximum value. |
Case Measures | # Total Events | Measure | The total event count, filters are ignored. Can be used in gauge diagrams to show the maximum value. |
Case Measures | # Total Variants Grouped | Measure | The total grouped process variants count, filters are ignored. Can be used in gauge diagrams to show the maximum value. |
Activity Group Map
The ActivityGroupMap defines the mapping from one grouped activity to the list of the detailed activities.
| Field Name | Data Type | Description |
|---|---|---|
| activity_grouped | Text | The name of the grouped activity. |
| activity_list | Text | The list of all detailed activities this group consist of. |
Filter Tables
In addition to the tables mentioned above two filter tables FilterAndGrouped and FilterOrGrouped are part of the data model. These tables are mandatory for the use of the ps4PBI visuals and are not to be removed.