
Histogram Brush
Setup
Import the visual via the menu into the existing report, the name of the visual is psHistogramBrush.pbiviz.
Working with the template files
Within the process.science template files all visuals have no license key. Before you can start working with the template files you need to add the provided license key as explained in the chapter Loading the license key into the report.
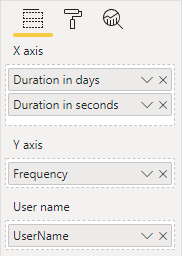
Afterwards you have to add one dimension to the X axis bucket and one dimension to the Y axis bucket. After you have done this, the graph is displayed.
Tip
You can add multiple dimensions to the X axis bucket to create a drilldown within the visual.
Important
To be able to work in edit mode, you must drag the measure UserName from the table Cases into the field User Name of the visual.
The visual has the following icon in the menu:

Functionalities
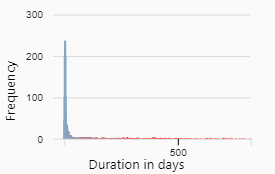
The Histogram Brush by process.science provides a simplified filter functionality in combination with a histogram chart.
Filtering
In order to filter data you need to brush over the area of the chart you want to create a between filter. After filtering the selected are will be highlighted within the visual. You can always extend the area by using the handles or moving the whole area by dragging it.
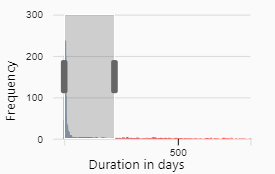
The created filter can be removed by clicking into the bar area a single time, or if you selected the whole area by double clicking within the visual.
Settings
In the following chapters the possible settings are explained.
X axis
Settings for the X axis of the chart.
| Setting | Description |
|---|---|
Show | Switch if the X axis should be shown. |
Show title | Switch if the title of the axis should be shown. |
Title | The title of the axis, defaults to the name of the X axis dimension. |
Bar width | The width of each bar within the chart. |
Y axis
Settings for the Y axis of the chart.
| Setting | Description |
|---|---|
Show | Switch if the Y axis should be shown. |
Show title | Switch if the title of the axis should be shown. |
Title | The title of the axis, defaults to the name of the X axis dimension. |
Show grid lines | Switch if the grid lines should be shown. |
Color | The color of the axis grid lines. |
Orientation | The orientation of the Y axis (left or right). |
Scale option | The scale option of the Y axis labels (linear, sqrt, log). |
Color settings
In the Color settings submenu, you can adjust the default colors of the elements within the chart.
| Setting | Description |
|---|---|
Use gradient | Switch if a color gradient should be used for coloring the bars. |
Default bar color | The color of the bars, if the gradient should not be used. |
Start color | The start color of the gradient. |
End color | The end color of the gradient. |
Brush color | The color of the brush. |
Brush handle color | The color of the brush handles. |
Text settings
In the Text settings submenu, you can adjust the texts of the chart.
| Setting | Description |
|---|---|
Font size | The font size of the labels within the chart. |
Tick font size | The font size of the tick labels. |