
Process Analyzer
Setup
Import the visual via the menu into the existing report, the name of the visual is psProcessAnalyzer.pbiviz.
Working with the template files
Within the process.science template files all visuals have no license key. Before you can start working with the template files you need to add the provided license key as explained in the chapter Loading the license key into the report.
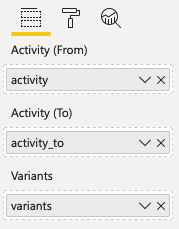
Afterwards, at least the dimensions activity, activity_to & variants from the eventlog table must be added to the visual. Then the process graph is drawn.
Important
To be able to work in edit mode, you must drag the measure UserName from the table Cases into the field User Name of the visual.
The visual has the following icon in the menu:

Use Bookmarks
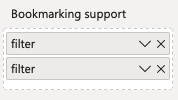
To be able to use the Process Analyzer with bookmarks, the field filter from the tables FilterAnd and FilterOr must be added to the visual.
Functionalities
The Process Analyzer by process.science offers you a range of functionalities to analyze your processes as detailed as possible. These are described in the following chapters.
Change Display Mode
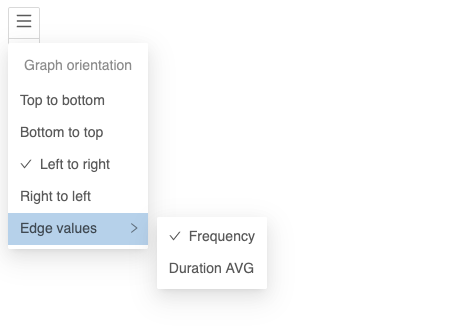
Further dimensions can be entered via the Edge values field which are then displayed at the edges of the process graph. Depending on this value the thickness and color intensity of the edges is also changed. If more than one dimension is entered it is possible to switch between them via the menu Edge values within the visual. The currently selected mode is highlighted by a checkmark.
Adding Additional Information to Nodes and Edges
As drescribed in the previous section you can add additional data to the graph that will be shown in the graph and change the look of it. The following four options are available:
Edge values : Add one or more values to be shown on the transitions of the graph. These will be used to change the saturation and thickness based on the value of the measure. You can change the currently selected edge value as described in the previous section.
Edge pop up values : Add one or more values to be shown in the transitions pop up which will be shown, if you hover over transitions. These values do not change the saturation or thickness of the graph and will not be shown in the display mode menu. Every measure you added to the Edge value field will automatically be shown in the pop up and there is no need to add it in the Edge pop up values field again.
Activity values : Add one value to be shown on the nodes of the graph. This will be used to change the saturation of the node based on the value of the measure. Also this value will be shown direclty inside the node, if this is activated like explained in the section Graph Layout.
Activity pop up values : Add one or more values to be shown in the activity pop up which will be shown, if you hover over an activity. These values do not change the saturation of activities within the graph and will not be shown in the node itself. The measure you added to the Activity value field will automatically be shown in the pop up and there is no need to add it in the Activity pop up values field again.
Working with Durations
If you want to use fields that should be displayed as duration you need to name them containing at least one of the following words (case insensitive): duration, dauer, durata, duración, durée, czas trwania, duração. Only then they can be identified to be displayed as a duration and not a normal number.
Change Display Direction
You can change the display direction of the graph at any time during the analysis, the different display directions can be found in the menu item in the upper left corner within the visual. This does not affect the default of the graph orientation, proceed as described in the section Graph Layout.
Filtering
Various filter options are available as described in the following chapters.
Event Filtering
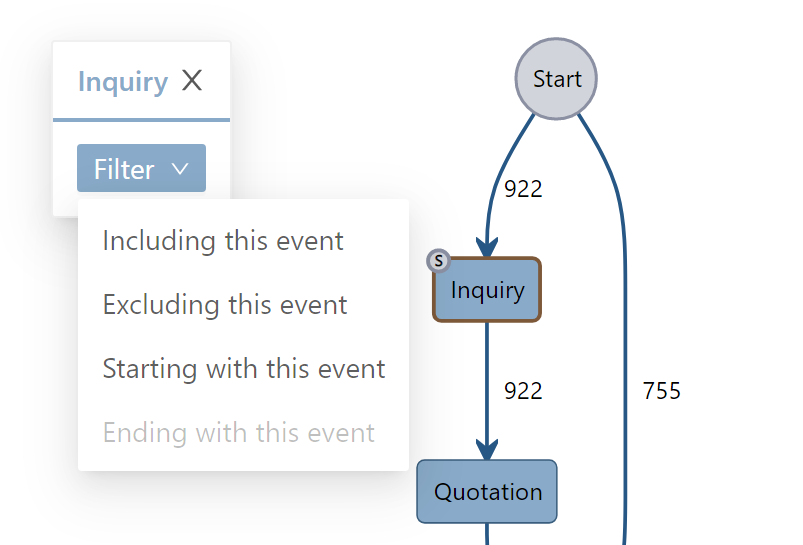
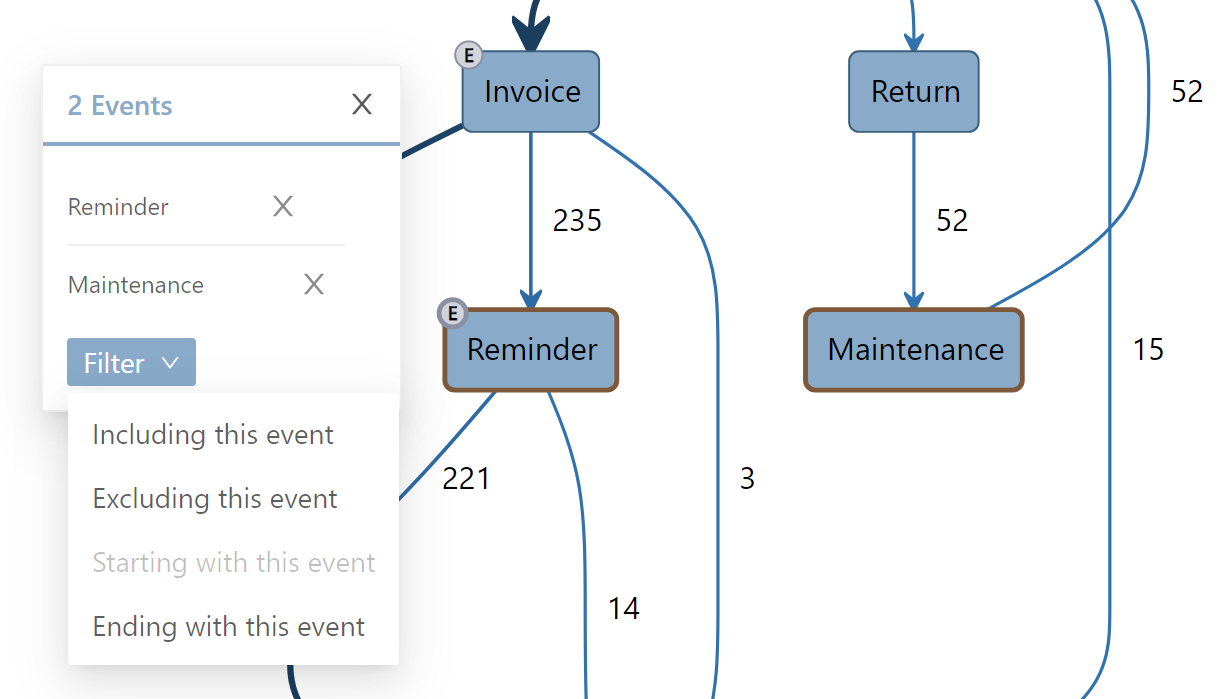
Clicking on an event opens the detail and filter window, where you can filter the graph in the following four ways:
Including this event : Displays all process variants that contain the selected event at least once.
Excluding this event : Displays all process variants that do not contain the selected event.
Starting with this event : Displays all process variants that start with the selected event.
Ending with this event : Displays all process variants that end with the selected event or are in this status at the time of the data deduction.
Info
If a filter option is greyed out, this means that there is no (new) case for this option.
Transition filtering
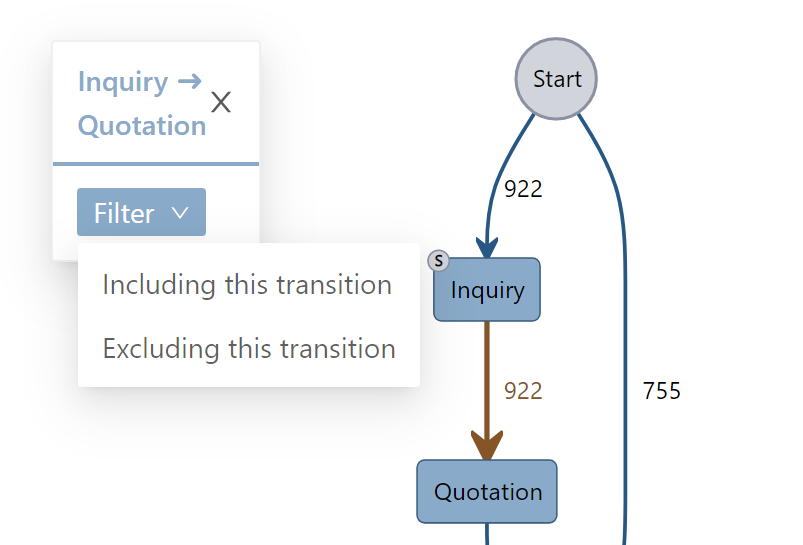
Clicking on a process transition opens the detail and filter window, where you can filter the graph in the following two ways:
Including this transition : Shows all process variants that contain the selected transition.
Excluding this transition : Shows all process variants that do not contain the selected transition.
Selecting multiple events and transitions
Holding Shift while clicking on an event or transition initiates the multiple selection. All selected transitions or events are displayed in the window and can be removed by the X at the end of the line. The same filter options are available as for the simple selection, but an OR link is created here for all events and transitions.
Activity groups
If you transformed the event log including activity groups you can add the information of the detailed activity list or the name of the group to the Process Analyzer using the Activity groups bucket. You also need to activate the switch Is grouped mode and add the suffix Grouped in the Differing table suffix both within the Process settings section.
Drillthrough
You can use the Power BI drillthrough functionality on events. In order to activate this you need to enable the modern visual tooltips as explained in this articel.
Swim lanes
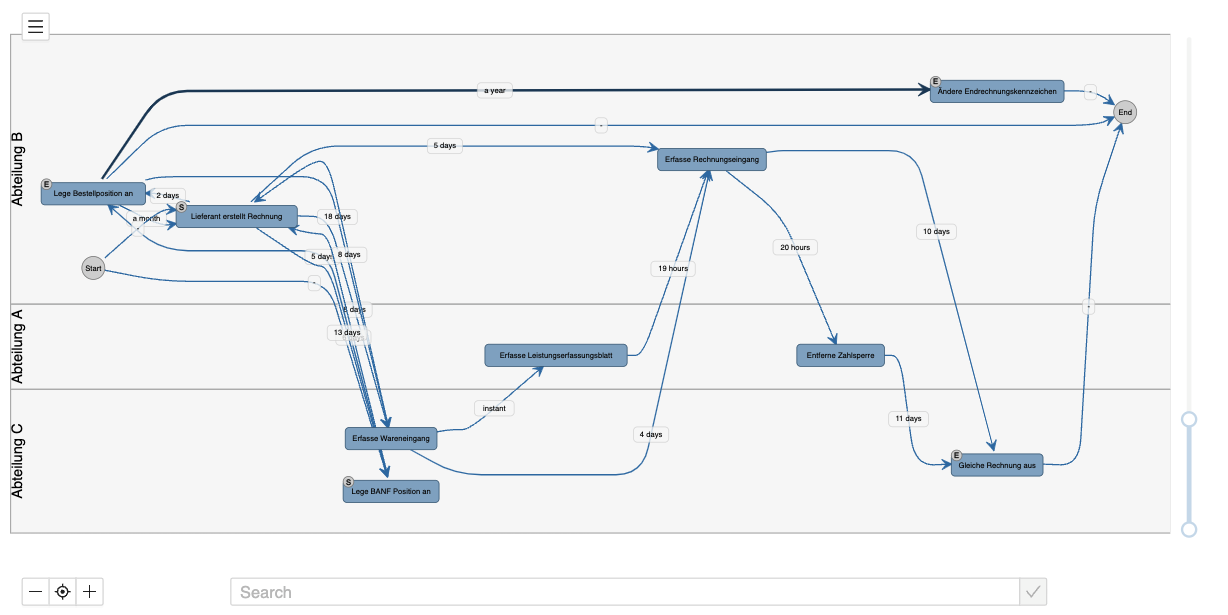
You can group activities into swim lanes by adding a swim lane name to each activity and adding this value to the Swim lanes bucket.
Activity legend
You can highlight activities based on specific values (e.g. Source System) by adding values to the Activity legend bucket. Withing the formatting pane you can than change how the legend and activities should be displayed.
Adjust Complexity of the Process Graph
On the right edge of the visual, there is a slider with which you can adjust the number of displayed process variants. Initially, rare process variants are hidden. You can show them by moving the slider up. The slider can be moved both from the top and the bottom, which allows you to restrict exactly which process variants are to be displayed.
Info
The slider is deactivated if no new process variants can be added.
Event and Transition Search
The event and transition search is a text field in the lower part of the visual. It assists with finding specific events and transitions in complex graphs.
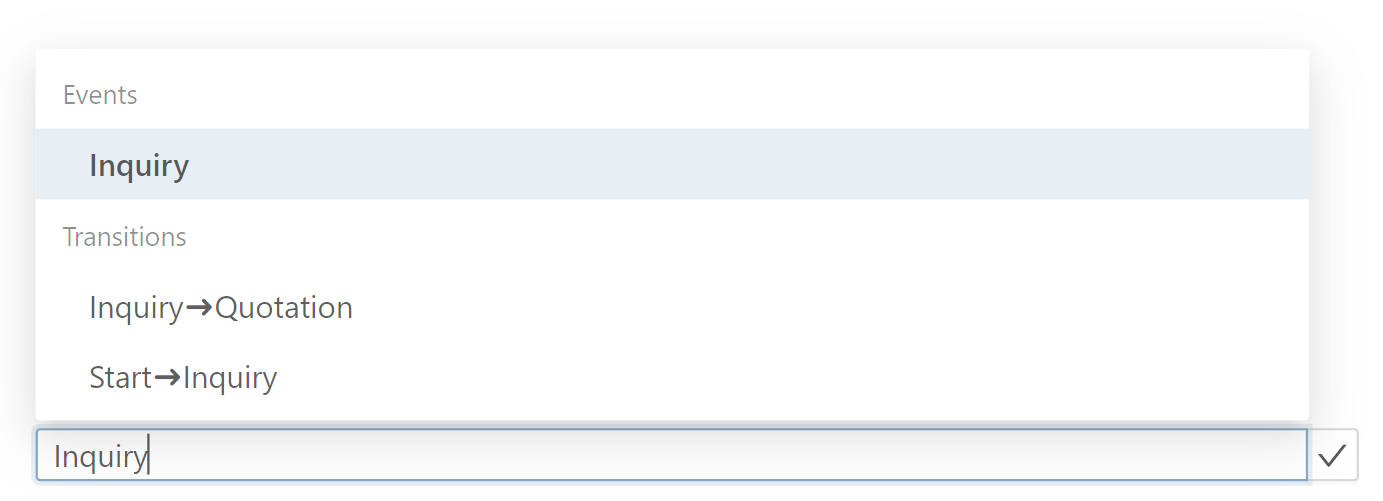
Typing Event A-> will find all transitions starting from event A. The arrow separates the event from the next possible events, so ->Event A will find all transitions leading to Event A.
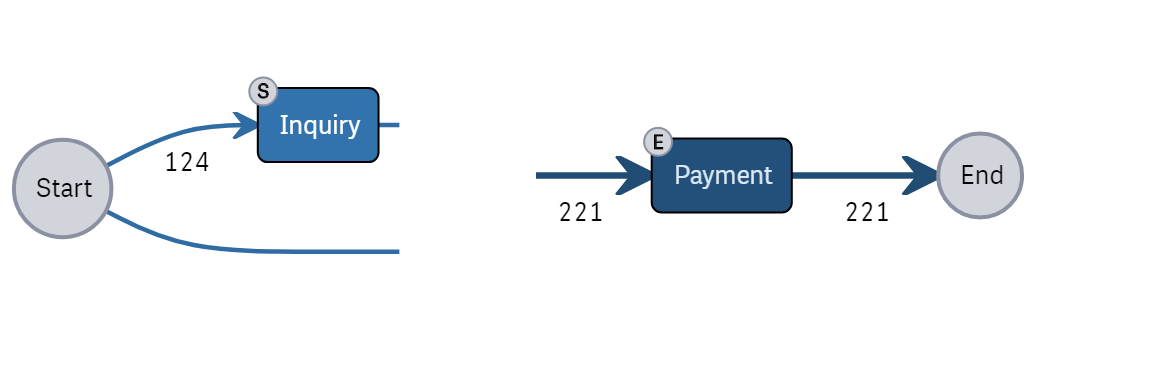
In large graphs it is also hard to find start and end nodes. In order to help finding these the nodes are highlighted if they are a start node (S), an end node (E) or both (S/E).
Activity details in filter pop up
You can add activity detail texts and links which will be shown in the activity filter pop up. Just add data to the Activity details bucket. If you want to add links the type of the field needs to be WebURl, the name of the field will the the display name of the link.
Activity Icons
You can add activity icons to the graph by adding a Base64 string or a unicode to the Activity icon bucket. You can change the position of the icon in the settings.
Settings
In the following chapters the possible settings are explained.
Process Settings
In the submenu Process settings you can adjust the settings regarding the process itself.
| Setting | Description |
|---|---|
Show loops | With the Show loops setting you can decide whether loops should be displayed in the process graph. A loop is defined as a transition from event A to the same event A. |
Is grouped mode | Flag if the current process analyzer shows activity groups or not. Will be used to determine which group icon should be shown + or -. |
Differing table suffix | Add the suffix of the additonal event log filter tables if you are working with multiple event logs in the same Power BI report. For example Grouped if you are working with groups. |
Different table prefix | Add a prefix for the filter tables if their naming conventions differ from the standard conventions. For example, v_ if your filter tables start with v_. |
Graph Layout
In the submenu Graph layout you can adjust the default settings for the Layout of the process graph.
| Setting | Description |
|---|---|
Graph orientation | The Graph orientation setting allows you to select the graph orientation that should be selected by default when the extension is initially loaded. |
Node separation | The Node separation setting adjusts the distance between the nodes in rank, i.e. a plane of the graph. |
Rank separation | The Rank separation setting adjusts the distance between ranks, i.e. the planes of the graph. |
Margin (X-axis) | The Margin (X-axis) setting adjusts the distance on the horizontal of the graph to the edge of the graph container. |
Margin (Y-axis) | The Margin (X-axis) setting adjusts the distance on the vertical of the graph to the edge of the graph container. |
Edges
In the submenu Edges you can adjust the default settings for the Layout of the process edges.
| Setting | Description |
|---|---|
Main color | The main color, will be used if the color scale is disabled. |
Use color scale | Select wether to use the color scale. |
Minimum color | The color of edges with the minimum edge value. |
Maximum color | The color of edges with the maximum edge value. |
Use width scale | Select wether to use the width scale. |
Minimum width | The width of edges with the minimum edge value. |
Maximum width | The width of edges with the maximum edge value. |
Number of groups | The number of groups used for the width and color scale. |
Number of edge values | The number of edge values shown in the graph at the same time. |
Nodes
In the submenu Nodes you can adjust the default settings for the Layout of the process nodes.
| Setting | Description |
|---|---|
Main color | The main color, will be used if the color scale is disabled. |
Use color scale | Switch to activate the color scale mode. Nodes will be highlighted based on their activity value. |
Scale mode | Change if you want the threshholds to be absolut or percentage values. |
First threshhold | First threshhold is from min to your input number. |
Second threshhold | Second threshhold is from your input number to max. The values between first and second threshhold will be the third group. |
First area color | The color of nodes within the first threshhold. Only used when the Scale mode is not set to 'linear'. |
Second area color | The color of nodes within the second threshhold. Only used when the Scale mode is not set to 'linear'. |
Third area color | The color of nodes within the third threshhold. Only used when the Scale mode is not set to 'linear'. |
Minimum color | The color of nodes with the minimum node value. Only used when the Scale mode is set to 'linear'. |
Maximum color | The color of nodes with the maximum node value. Only used when the Scale mode is set to 'linear'. |
Number of groups | The number of groups used for the width and color scale. Only used when the Scale mode is set to 'linear'. |
Activity Layout
In the submenu Activity layout you can adjust the default settings for the activity layout of the process graph.
| Setting | Description |
|---|---|
Show grouped icon | Select wether to hide or show the grouped info icons on the events (+ or -). |
Show start and end indicator | Select wether to hide or show the S, E or S/E info icons on the events. |
Same size for all events | Select wether all activities should have the same size (Size of the biggest node). |
Show activity values | Select wether the provided activity value should be shown in the node and the tooltip, or only the tooltip. |
Show text of activity value | Select, if you want to show the name of the measure before the activity value. |
Number of activity values | Select the number of activity values you want to show directly on the node. |
Line break | The number of words after how many you want to have a line break, 0 means no line breaks. |
Show the progress bar | Select wether to hide or show the progress bar: Read more. |
Progress bar color | The color of the progress bar. |
Show activity icon | Show an activity icon (either as Base64 or unicode). |
Icon position | Position of the icon (left or right bottom corner). |
Icon Size | The size of the icon (10 - 25). |
Progress bar
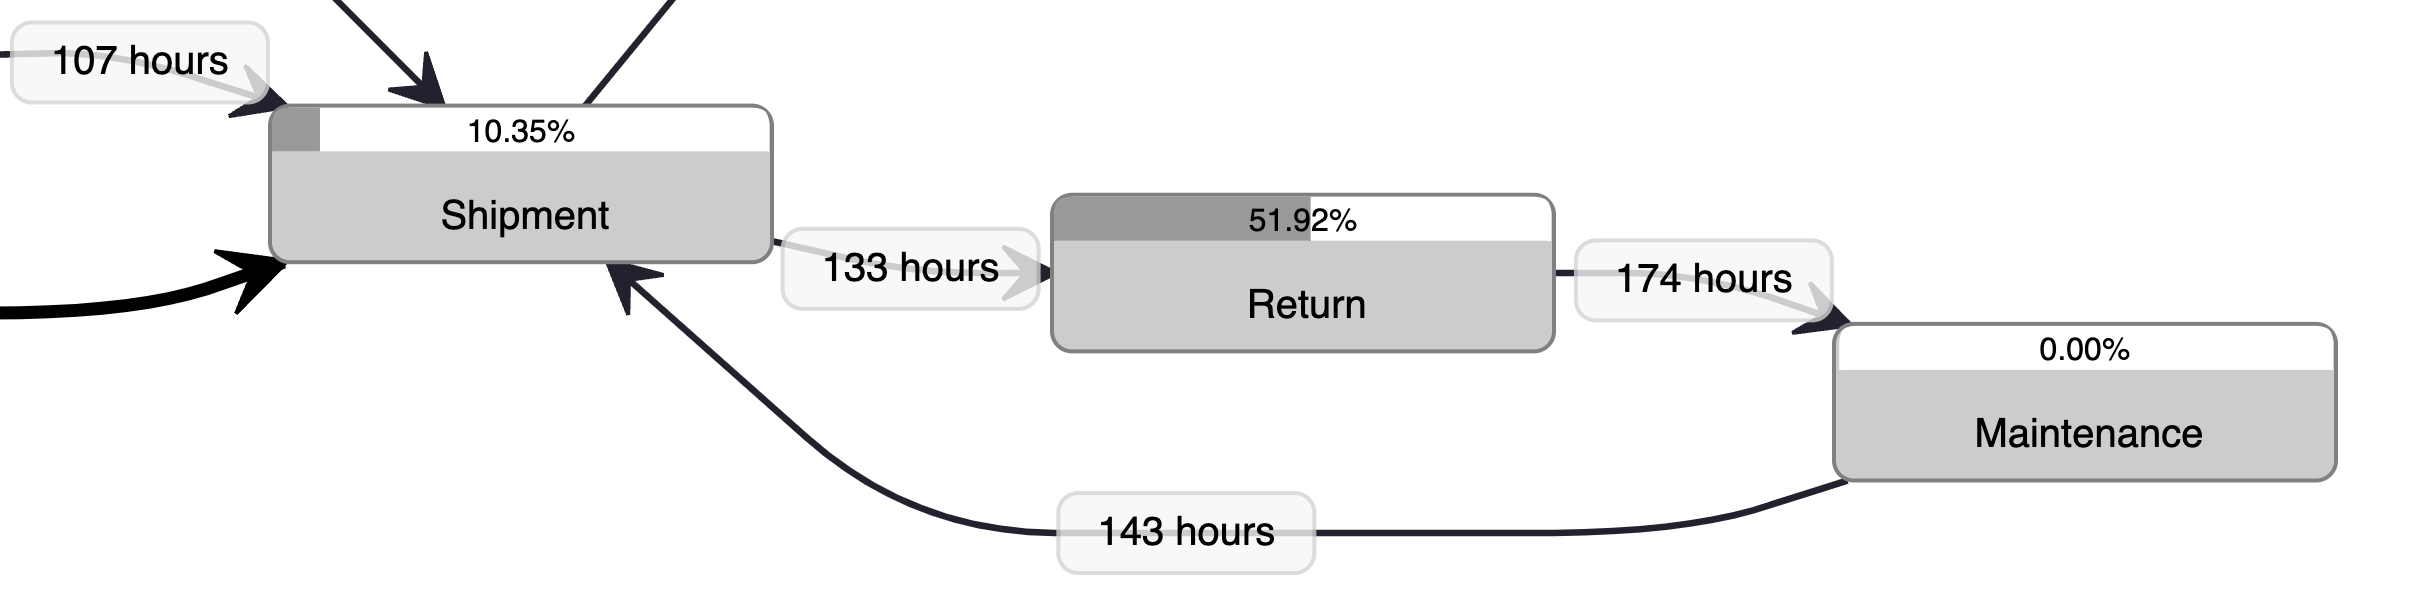
The progress bar can be used as an alternative to the normal display of activity values and is particularly useful for percentage values. The maximum value of the progress bar is always the highest value of the activity value. Only if the value is marked as a percentage, the maximum value is automatically set to 100%.
Target Process
In the submenu Target process you can adjust the default settings for the target process.
Enable the target process
The Enable target process setting allows you to highlight your target processes in the process graph to see deviations directly and also to create filters for them. If this setting is activated, the measure targetProcesses from the TargetProcesses table must be added to the visual. You can add additional target processes to this table using the following syntax:
Event A,Event B,Event C,Event D&&Event A, Event B, Event D
Events are lined up, separated by a comma, in the order of the target process. If several target processes are to be represented, they can be separated by &&. An example will be provided within the dashboard template. By activating the target process, the menu item Target process filter is displayed in the visual. Here a filter can be created for all process variants that contain the target process, or deviate from it.
Show the full target process
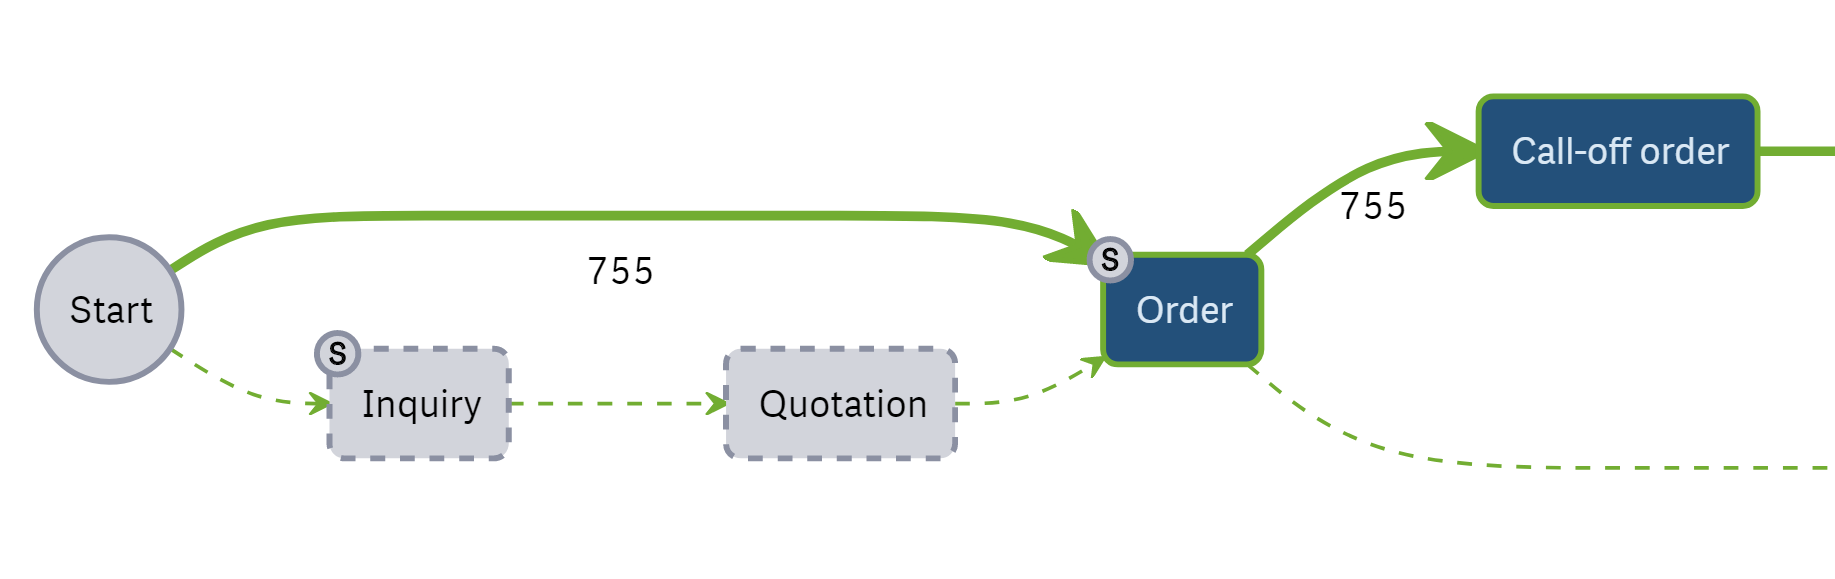
In addition to the actual target process setting, the Display unfiltered target process setting can be used to specify whether the entire target process should always be displayed, even if a specific event is not present in the current selection, or whether the existing events should be highlighted if they are part of the target process.
If it is activated the following options for activities and transitions are possible:
Transitions:
- Modelled in target process and in actual process: Highlighted with target process color.
- Modelled in target process but not in actual process: Highlighted with target process color, dotted line.
- Not modelled in target process but in actual process: Main color of the view mode or specified color in Color for compliance.
Activities:
- Modelled in target process and in actual process: Highlighted with target process color.
- Modelled in target process but not in actual process: Greyed out, dotted border line.
- Not modelled in target process but in actual process: Main color of the view mode or specified color in Color for deviation.
| Setting | Description |
|---|---|
Display unfiltered target process | Show the full target process as described in Show the full target process. |
Color nodes | Specify if you want to color the nodes in the main or target process colors. |
Color for compliance | The color used for paths and activities compliant with the target process. |
Determine color of deviations automatically | Specify if deviating events and transitions should be in the main or Color for deviation color. |
Color for deviation | The color used for paths and activities not compliant with the target process. |
Legend
In the submenu Legend you can adjust the default settings for the Legend of the process graph.
| Setting | Description |
|---|---|
Color full nodes | Switch if the full node or only the bordor should be highlighted. |
Border width | Width of the node borders when being highlighted. |
Show legend | Switch if the legend should be shown. |
Position | Position of the legend, e.g. Top, Bottom, ... |
Title | Switch to show or hide the legend bar. |
Legend name | The name to display in the legend. |
Color | The color of the text labels within the legend bar. |
Font family | The font family of the labels within the legend bar. |
Text size | The text size of the labels within the legend bar. |
Formatting for duration
In the submenu Formatting for duration you can adjust how the durations within the graph should be displayed. Each setting can be applied to transition or tooltip values.
| Setting | Description |
|---|---|
Automatic format | Switch if the automatic format should be used. |
Units | Duration unit which should be used (eg. Years, months, ...). |
Round values | Switch if the value should be round to the smallest unit displayed. |
Maximum decimal points | Number that defines a maximal decimal points for float values. |
Swim Lanes
In the submenu Swim lanes you can adjust the default settings for the swim lanes of the process graph.
| Setting | Description |
|---|---|
Margin between Swim Lanes | Margin between each swim lane in pixel. |
Border Radius | The border radius of each swim lane. |
Fill Color | The fill color of each swim lane. |
Fill Opacity | The fill color opacity of each swim lane. |
Stroke Color | The stroke color of each swim lane. |
Stroke Width | The stroke width of each swim lane. |
Text Position | The text postion of the swim lane labels (left, right, top, bottom). |
Font color | The font color of the swim lane labels. |
Font size | The font size of the swim lane labels. |
Menu
In the submenu Menu, you can adjust the default settings for the menu & menu items of the process graph.
| Setting | Description |
|---|---|
Show navigator | Show or hide the navigator in the bottom right corner. |
Small menu items | The Small menu items setting allows you to adjust the size of all menu items. When the switch is set to On, all menus are displayed more compactly. |
Menu color | The color of the menu items. |
Variant settings
In the submenu Variants settings, you can adjust the default settings for the process variants.
| Setting | Description |
|---|---|
Initially displayed Variants | The Initially displayed variants setting controls the number of initially displayed variants. For example, if the value is set to 80, the top 80% of variants are displayed initially and the granularity sliders are adjusted accordingly. If the value 100 is selected here, all variants are displayed initially. |
Most frequent variants | The Most frequent variants setting can be used to specify that either the most frequent or the rarest X% of variants are loaded when the graph is loaded. X is defined through the Initially displayed variants setting. |