
Variants / Case Analyzer
Setup
Import the visual via the menu into the existing report, the name of the visual is psVariantsAnalyzer.pbiviz.
Working with the template files
Within the process.science template files all visuals have no license key. Before you can start working with the template files you need to add the provided license key as explained in the chapter Loading the license key into the report.
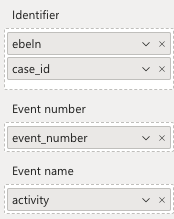
Then you have to add one identifier dimension like path_id oder case_id from the Cases table and event_number & activity from the Eventlog table to the visual. After you have done this, the process variants / cases are displayed. Each process event is displayed in a separate chevron and color. The color of an event is the same in each process variant, so it is easy to detect a difference between the process variants.
Important
To be able to work in edit mode, you must drag the measure UserName from the table Cases into the field User Name of the visual.
The visual has the following icon in the menu:
Functionalities
The Variants / Case Analyzer by process.science offers you a range of functionalities to analyze your process variants and each case as detailed as possible. These are described in the following sections.
Filtering
Identifier level
This data record is selected by Shift-clicking on the left-hand field of each line, for example the case id or variant. Within the visual, the other process variants are also displayed and can be selected. By holding down Ctrl during a Shift-click, multiple rows can be selected simultaneously.

Activity level
Selecting one activity will select this activity in oll of the rows and within the report. By holding down Ctrl during a click, multiple activities can be selected simultaneously.

Adding additional identifier values
When hovering over the box of each row, the identifier is displayed in a tooltip. Additional information can be added using the Identifier values field, which is also displayed in the tooltip. Use values from the Cases table, for example. The standard formatting options you can set for each field will be used to format the values.

Working with Durations
If you want to use fields that should be displayed as duration you need to name them containing at least one of the following words (case insensitive): duration, dauer, durata, duración, durée, czas trwania, duração. Only then they can be identified to be displayed as a duration and not a normal number.
Adding additional event values
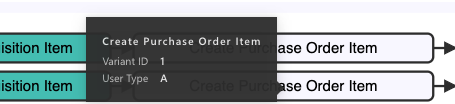
When hovering over an activity, the name is displayed in a tooltip. Additional information can be added using the Event values field, which is also displayed in the tooltip. Use values from the EventLog table, for example. The standard formatting options you can set for each field will be used to format the values.
Adding event highlights
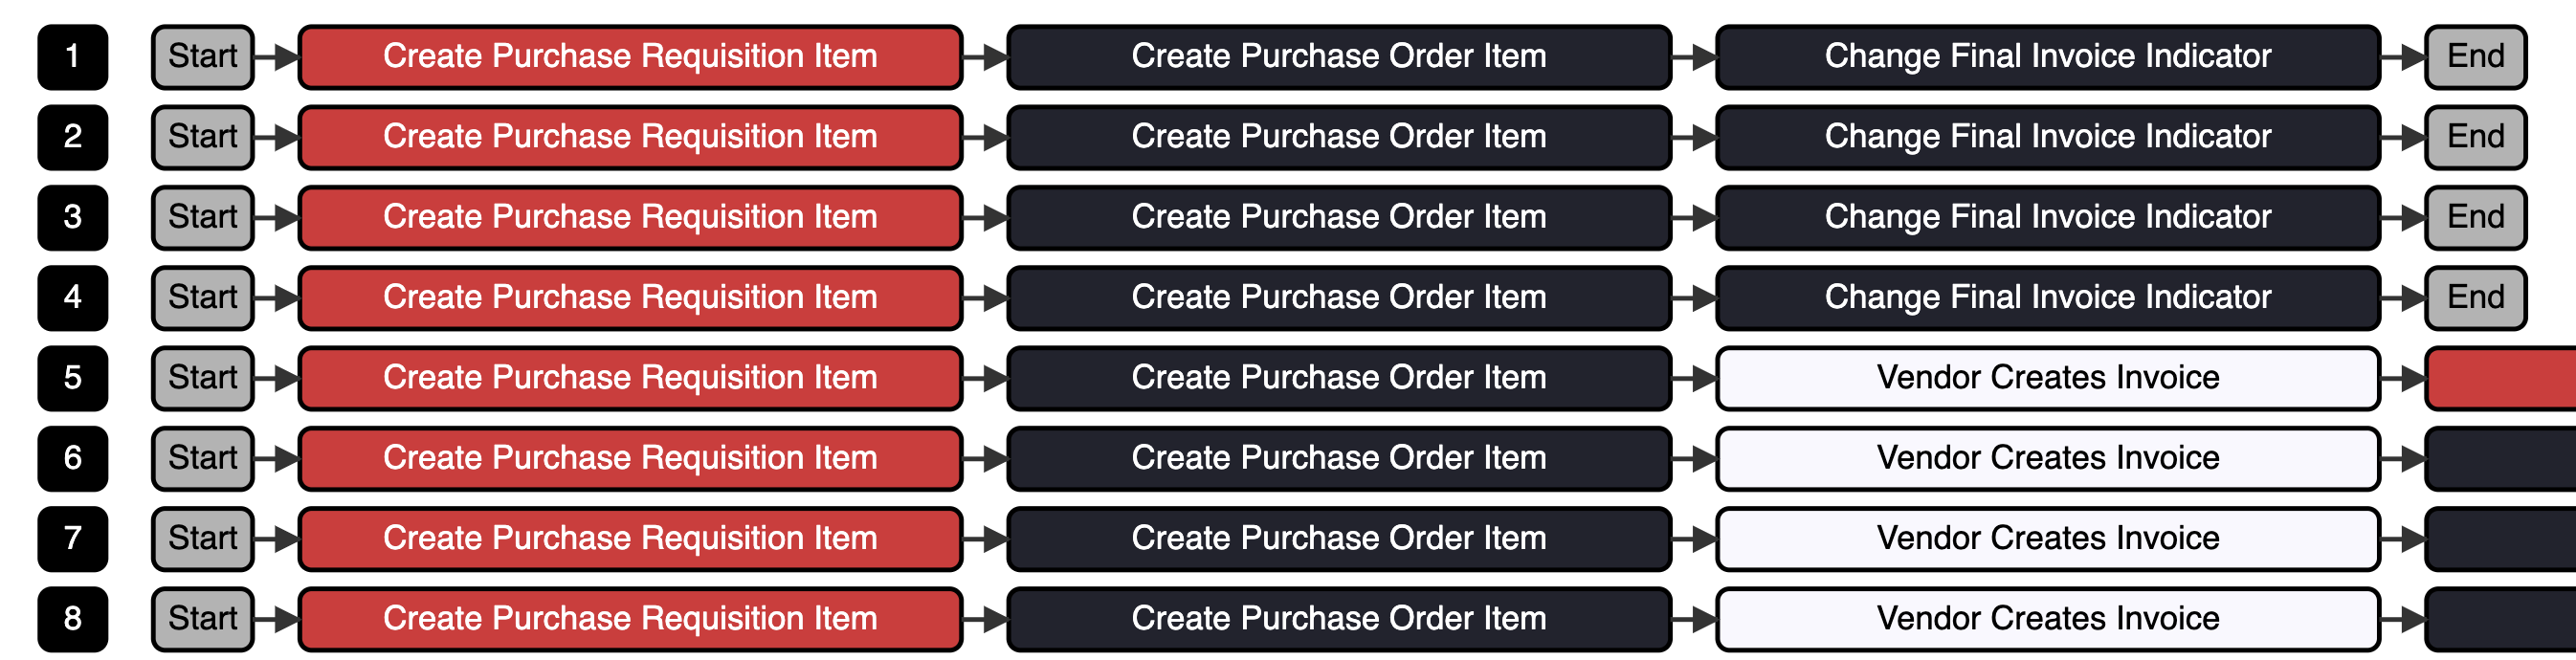
The Highlight field can be used to enter values per activity and identifier to highlight the activities. This can be the user, for example, to highlight segregation of duties problems. The value is then also displayed in the activity pop-up. The colors can be adjusted in the Chevron Settings section of the properties.
Displaying event values on nodes
Values that are used as event or event highlight values can also be displayed directly on the node. This must be activated in the Display Settings. You can set whether the highlight value is displayed there or only the normal event values. Up to four values can be displayed.

Add multiple levels
You can add multiple levels to group the process variants / cases. To do this, drag several fields into the Identifier field. For example, you can add a level for the process variant and another level for the case. The levels can be changed in the order in which they are to be displayed. To do this, use the  icon to access the next level and
  to access the previous level.


Create a hierarchy view
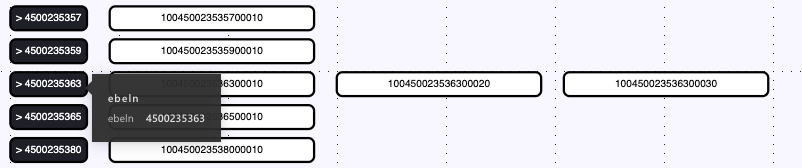
You can create a hierarchy view by dragging several fields into the Identifier field. The order of the fields determines the order of the hierarchy. Now use the  icon to expand the hierarchy, each click loads another level of the hierarchy. You will now see an arrow symbol at the index node, which you can use to expand each line of the hierarchy.
The document 4500235363 has three positions, i.e. cases that are below the hierarchy level 4500235363. If you click on the arrow symbol, these cases are displayed.

Add Swim Lanes
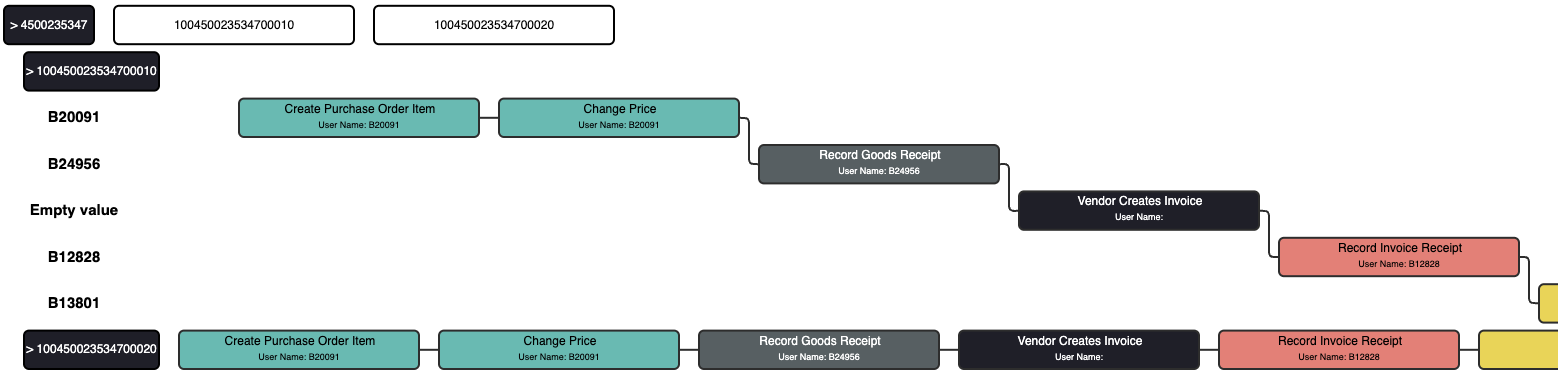
You can add swimming lanes by dragging a field into the Swim lanes field. At the lowest level of a hierarchy, or if there is no hierarchy, each row is displayed as a swim lane. The last line can be expanded by clicking on the index node and the swimming lanes are displayed. In combination with the highlight function, you can, for example, colour and highlight the activities according to user groups.
Hightlight the target process
You can add your target process to the Variants / Case Analyzer in order to hightlight activities that are compliant or deviating from it. Just add the measure TargetProcess to the bucket Target process and activate it in the settings pane.

Settings
In the following chapters the possible settings are explained.
Display settings
In the Display settings submenu, you can adjust the default display settings for the Variant Analyzer.
| Setting | Description |
|---|---|
Same size for all elements | Switch if all activity elements should be the same size or not. |
Font size | The Font size setting allows you to change the font size of the events. |
Show Start and End | With the setting Show 'Start' and 'End' you can set whether start and end should be shown as a separate chevron or be hidden. |
Show highlight value at node | The setting is used to set whether the highlight value is also displayed directly at the node or is only used for the coloring and legend. |
Display activity values at node | The setting can be used to set whether the activity values should also be displayed directly at the node. By default, this includes the highlight value. |
Show text of the activity value | This setting determines whether the text of the activity value is to be displayed or only the value. |
Number of Activity Values | The setting is used to set the maximum number of activity values at the node (1-4). |
Limit of activities displayed per line | This setting allows you to set the number of activities that are loaded per line. New activities can be added incrementally using a button at the end of the line. |
Limit of displayed rows per level | This setting allows you to set the number of rows that are loaded per level. New rows can be added incrementally with a button at the end of the rows. |
Index settings
Settings for the index fields of the individual process variants.
| Setting | Description |
|---|---|
Rect color | Fill color of the index fields. |
Start and end node color | Fill color of the boxes Start and End. |
Chevron settings
Settings for the event fields of the individual process variants / case. If an highlight value is specified all highlight categories will be displayed.
| Setting | Description |
|---|---|
Color mode | Sets whether to color based on a color (Uniform), a gradient (Gradient) or based on the activity or highlight value (By Category). |
Color | Sets the uniform color or start color of the gradient. When coloring by category, each activity name/category displayed is shown and the color can be adjusted. |
Target process settings
In the Target process settings submenu, you can adjust the default target process settings for the Variant Analyzer.
| Setting | Description |
|---|---|
Color nodes | Flag, if the whole node should be colored, or only the stroke of the chevron. |
Color for compliance | The color used for activities compliant with the target process. |
Color for deviation | The color used for activities not compliant with the target process. |
Stroke width | Stroke width, used when color nodes is set to false. |