
Lead Time Analyzer
Setup
Import the visual via the menu into the existing report, the name of the visual is psLeadTimeAnalyzer.pbiviz.
Working with the template files
Within the process.science template files all visuals have no license key. Before you can start working with the template files you need to add the provided license key as explained in the chapter Loading the license key into the report.
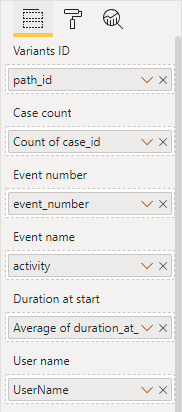
Afterwards you have to add the dimensions path_id and the Count of case_id from the Cases table and event_number, activity & average of duration_at_start from the Eventlog table to the visual. After you have done this, the possible events are displayed.
Important
To be able to work in edit mode, you must drag the measure UserName from the table Cases into the field User Name of the visual.v
The visual has the following icon in the menu:

Functionalities
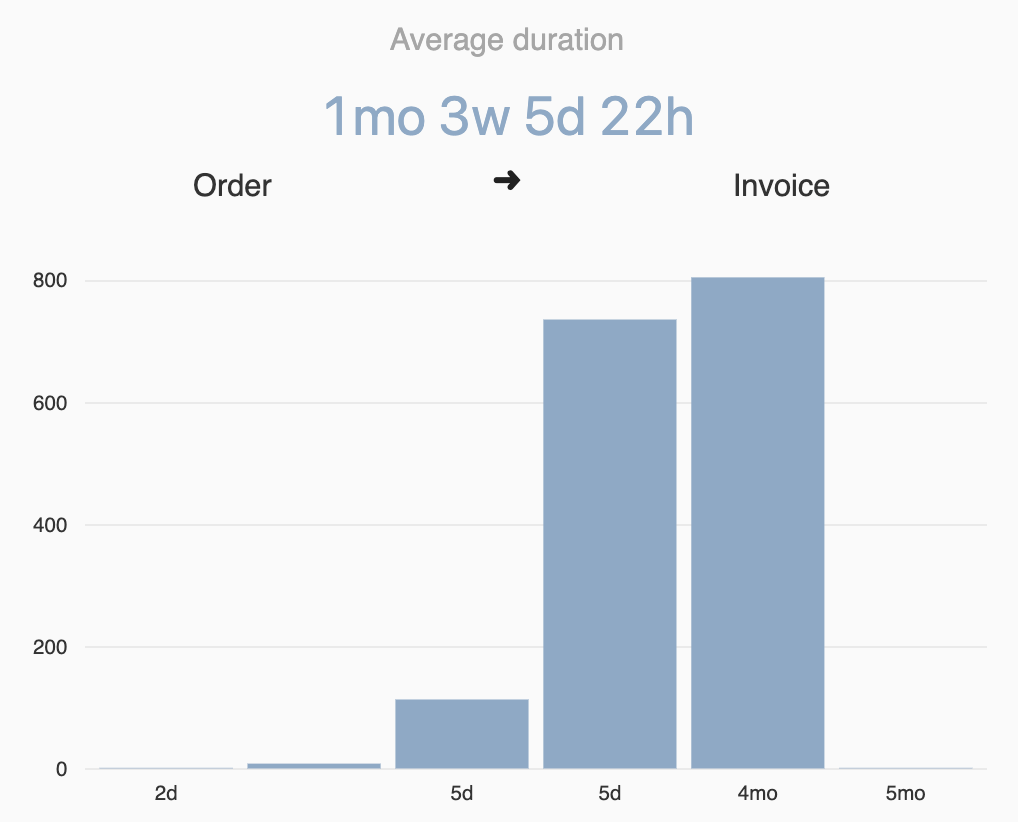
The Lead Time Analyzer by process.science is used to show lead times between two specific events. You can choose between a view which is more like a kpi and one with an additional bar chart showing the breakdown by duration and variants.
Filtering
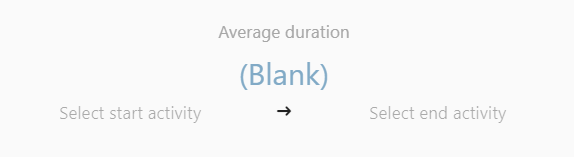
In order to show the calculated duration and the breakdown by duration and variants in the bar chart you need to select two activities. First select the start activity in the left input and the end activity in the right input. After you selected both the duration will get calculated.
Tip
Within the select input you can type and search for activities. You don't need to scroll through the list in order to find the activity you want to select.
To delete the selection you need to click on the X within either the left or right input. Afterwards the selection will be cleared and you can select new activities.
Settings
In the following chapters the possible settings are explained.
Data label
In the Data label settings submenu, you can adjust the default display settings for the Data label.
| Setting | Description |
|---|---|
Color | The color of the data label text. |
Text size | The text size of the data label. |
Margin top | Specify the margin above the data label. |
Category label
Settings for the Category label.
| Setting | Description |
|---|---|
Show | Switch if the label should be shown. |
Color | The color of the category label text. |
Text size | The text size of the category label. |
Activity label
Settings for the Activity labels.
| Setting | Description |
|---|---|
Color | The color of the activity label text. |
Text size | The text size of the activity label. |
First or last occurence | Select if the first or last occurence of the activity should be used for the calculation. |
Formatting for duration
In the submenu Formatting for duration you can adjust how the durations within the KPI should be displayed.
| Setting | Description |
|---|---|
Base Unit | Specify the base units of the duration. |
Show following units | Change the base untis (years, month, weeks, ...) that should be shown. |
Count of following units | The count of the following units after the base unit. |
Show long texts | Switch if the long or short texts should be shown (Days or d). |
Round values | Switch if the value should be round to the smallest unit displayed. |
Maximum decimal points | Number that defines a maximal decimal points for float values. |
Bar chart
Settings for the bar chart.
| Setting | Description |
|---|---|
Show | Switch if the bar chart should be shown. |
Bar color | The color of the bars. |
Number of bars | The number of bars to be displayed. |
X axis
Settings for the X axis of the bar chart, will only be shown, if the bar chart is active.
| Setting | Description |
|---|---|
Show | Switch if the X axis should be shown. |
Text size | The text size of the axis labels. |
Color | The color of the axis label text. |
Grid lines | Switch if the grid lines should be shown. |
Color | The color of the axis grid lines. |
Stroke width | The stroke width of the axis grid lines. |
Line Style | The line style of the grid lines (dashed, solid, dotted). |
Y axis
Settings for the Y axis of the bar chart, will only be shown, if the bar chart is active.
| Setting | Description |
|---|---|
Show | Switch if the Y axis should be shown. |
Text size | The text size of the axis labels. |
Color | The color of the axis label text. |
Grid lines | Switch if the grid lines should be shown. |
Color | The color of the axis grid lines. |
Stroke width | The stroke width of the axis grid lines. |
Line Style | The line style of the grid lines (dashed, solid, dotted). |